A federal court has approved a $700 million nationwide settlement resolving a multi-state lawsuit against Google over allegations that the technology company unlawfully monopolized Android app distribution and in-app payment services.
Arizona was among the states that helped bring the case against Google in 2021, joining a coalition of attorney generals representing all 50 states, the District of Columbia, Puerto Rico, and the U.S. Virgin Islands.
The lawsuit alleged that Google used its control over Android app distribution and Google Play billing to limit competition, reduce consumer choice, and charge consumers as much as 30% on certain transactions.
The settlement, approved August 18, ends a case that has been ongoing for approximately five years and establishes a $700 million fund to provide relief to eligible consumers nationwide.
Antitrust & Privacy Unit Chief Robert Bernheim and Senior Litigation Counsel Jayme Weber handled the case on behalf of Arizona.
Under the settlement, most of the $700 million fund will be distributed directly to consumers who made qualifying purchases through Google Play between August 16, 2016, and September 30, 2023.
Consumers who lived in Arizona or another participating jurisdiction during the relevant period may be eligible to receive a payment.
Most eligible consumers will not need to submit a claim form. Payments are expected to be distributed through electronic payment services, including PayPal and Venmo, according to the settlement distribution plan.
The settlement also requires Google to make significant changes to its business practices involving the Android ecosystem.
For at least five years, app developers will be permitted to use alternative billing systems, tell consumers about lower prices available outside Google’s billing system and distribute their apps through competing app stores without facing retaliation from Google.
Android users will also be permitted to download apps from sources outside the Google Play Store for at least seven years.
The changes are intended to provide consumers and app developers with greater choice in how applications are distributed and how purchases are processed.
The case was brought under the states’ parens patriae authority, which allows attorneys general to bring certain claims on behalf of consumers living in their respective jurisdictions.
The states alleged that Google’s practices resulted in consumers paying more for apps and in-app purchases while limiting their ability to choose alternative app stores and payment systems.
The states also alleged that Google made misleading representations concerning the risks of obtaining Android applications outside of the Google Play Store and regarding its billing practices.
Google has denied wrongdoing and, under the court’s final judgment, the settlement is not an admission or concession by Google of liability, fault, or wrongdoing.
U.S. District Judge James Donato of the Northern District of California issued the final approval order on August 18, funding the settlement and its distribution plan to be fair, reasonable, and adequate.
The court appointed Berkeley Research Group to assist the states with implementing the distribution plan and continued the appointment of Verita Global as settlement administrator.
The court will retain jurisdiction over the settlement’s implementation and distribution of the funds.
The court’s order also provides for a potential holdback of $93.62 million from an initial distribution if payments begin before a final ruling on attorney’s fees, costs, and incentive awards.
Any amount ultimately not awarded from that reserve would be returned to the settlement fund for subsequent distribution to eligible consumers.
Ethan Faverino is a reporter for AZ Free News. You can send him news tips using this link.
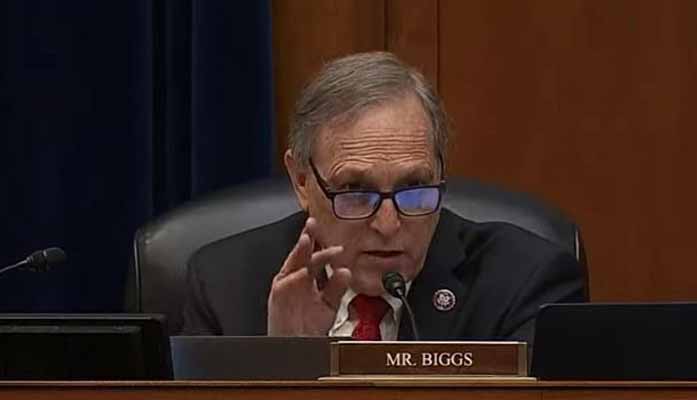
The United States has surpassed $40 trillion in national debt, marking another record for the federal government and prompting renewed criticism from Congressman Andy Biggs (R-AZ-05) over Washington’s continued spending and borrowing.
According to the Joint Economic Committee’s Debt Monitor, the national debt has increased by approximately $90,257.73 every second over the past year. That amounts to roughly $5.42 million per minute, $324.93 million per hour, and $7.8 billion per day.
The national debt crossed the $40 trillion threshold on August 18, 2026, according to U.S. Treasury data.
The milestone came less than five months after the national debt surpassed $39 trillion in March, highlighting the accelerating pace at which the federal government is adding to its debt burden.
The Treasury Department also reported a federal budget deficit of more than $432 billion in July, adding to concerns about the government’s fiscal trajectory.
Biggs, the Republican candidate for Arizona Governor, said the latest debt milestone demonstrates what he characterized as decades of congressional unwillingness to impose meaningful limits on federal spending.
“It was fitting that America reached this grim debt milestone while legislators were absent from our nation’s capital,” stated Congressman Biggs.“For decades, Members of Congress have shown catastrophic unseriousness about reining in government spending and leaving a better future for the next generation.”
“Regardless of which party controls Congress, I have sounded the alarm on this fiscal cliff since I entered the U.S. House of Representatives and have introduced legislation to help solve this crisis,” added Biggs. “Our children and grandchildren will be forced to suffer the immense consequences of this inaction and fear of making tough decisions. No one should be surprised when that time arrives for our great nation.”
The $40 trillion milestone represents a doubling of the nation’s debt in less than a decade. Treasury data shows that approximately $32.3 trillion is held by the public, while another $7.8 trillion consists of intergovernmental holdings.
Biggs has repeatedly made federal spending and the national debt a central focus of his legislative work in Congress. His office points to several measures he has introduced aimed at addressing the nation’s long-term fiscal problems.
Among them is a proposed constitutional amendment, H. J. Res. 139, that would require the federal government to operate under a balanced budget by permanently prohibiting deficit spending. The proposal would also establish a two-thirds supermajority requirement for any legislation creating a new federal tax.
Biggs has also introduced, H. Res. 631, a resolution formally recognizing America’s debt as a threat to national security, as well as hundreds of bills aimed at reducing non defense discretionary spending.
The latest debt milestone comes as the federal government continues to run deficits approaching $2 trillion annually. The Congressional Budget Office has projected that federal revenues in FY26 will total roughly $5.6 trillion, compared with approximately $7.4 trillion in federal spending.
The rapid increase in federal debt has also raised concerns over the growing cost of servicing that debt. Interest payments have climbed to more than $1 trillion annually, adding another significant expense to the federal budget.
For Biggs, the latest milestone represents another warning that Congress will eventually have to confront the consequences of continued deficit spending.
Ethan Faverino is a reporter for AZ Free News. You can send him news tips using this link.
Congressman Abraham Hamadeh (R-AZ-08) has introduced legislation to designate a section of Interstate 17 as the Mueller-Keating Memorial Highway, honoring the lives and sacrifices of two Arizonans who confronted the threat of ISIS through humanitarian service and military courage.
The Mueller-Keating Memorial Highway Act, introduced on August 13, would designate a stretch of I-17 running from Prescott to Phoenix, connecting the hometowns of Kayla Mueller and Chief Special Warfare Operator Charles H. Keating IV.
Mueller, known as “Arizona’s Angel,” was born and raised in Prescott, Arizona. She traveled to Syria to provide humanitarian assistance and was abducted by terrorists while leaving a Doctors Without Borders hospital in Aleppo in 2013.
Mueller was held captive for approximately 18 months before being killed by ISIS militants, including then-ISIS leader Abu Bakr al-Baghdadi.
Keating, a Phoenix native and U.S. Navy SEAL, was killed in Iraq while serving during Operation Inherent Resolve, the U.S.-led effort launched in 2014 to combat ISIS, reclaim territory taken by the terrorist organization, dismantle its network, and protect civilians from its violence.
Keating was the third U.S. service member killed during Operation Inherent Resolve.
🇺🇸NEW🇺🇸
Congressman Hamadeh Honored to Introduce the Mueller-Keating Memorial Highway Act
— Office of Congressman Abe Hamadeh (@RepAbeHamadeh) August 14, 2026
The proposed highway designation seeks to recognize what Hamadeh described as the “distinct, yet complementary” contributions of two Arizona heroes who confronted ISIS in different ways.
“Operation Inherent Resolve demanded both military force and humanitarian resolve, and this designation recognizes the distinct, yet complementary roles our beloved Arizonans played in that effort,” stated Congressman Hamadeh. “We can never forget the victims of ISIS and these two Americans that faced that evil with faith and courage.”
Hamadeh introduced the legislation one day before what would have been Mueller’s 38th birthday.
The congressman has previously highlighted Mueller’s legacy and efforts to bring her home.
During his swearing in ceremony, Hamadeh used the Mueller family’s Bible while taking his oath of office. He was joined at the ceremony by his family and Mueller’s parents, Carl and Marsha.
Hamadeh also traveled from Jerusalem to Damascus in August 2025 to meet with Syrian President Ahmed al-Sharaa and Syrian Foreign Prime Minister Asaad Hassan al-Shaibani.
During the trip, Hamadeh discussed his continuing efforts to recover Kayla Mueller’s remains and his broader “Peace Through Strength” agenda.
If enacted, the Mueller-Keating Memorial Highway would serve as a permanent tribute along I-17, linking Prescott and Phoenix while honoring two Arizonans whose lives became intertwined with the fight against ISIS and the broader conflict against terrorism.
Ethan Faverino is a reporter for AZ Free News. You can send him news tips using this link.
The federal government ran a $432.308 billion deficit in July, marking the largest monthly deficit since March 2021, according to the Joint Economic Committee’s latest Monthly Fiscal Update.
The July deficit brought the federal government’s total deficit for the fiscal year through July to $1.799 trillion. The figure is 10.46% higher than the $1.629 trillion deficit recorded during the comparable period in FY25.
The federal government has spent $1.40 for every $1 it has collected in revenue so far in FY26, with 28.62% of total outlays not covered by federal receipts.
For comparison, the federal government recorded a total deficit of $1.775 trillion during fiscal year 2025.
In July, the Fed gov ran a deficit of $432.308B, the largest monthly deficit since March 2021. FY2026-July, deficits were $1.799T. This means 28.62% of outlays in FY2026 were not paid for by revenues & for every dollar the Fed gov received in revenue, it spent $1.40.…
— Joint Economic Committee Republicans (@JECRepublicans) August 13, 2026
The Congressional Budget Office’s (CBO) most recent 10-year budget projections estimate that the federal deficit will reach $1.853 trillion in FY26, followed by $1.887 trillion in FY27 and $2.080 trillion in FY28.
Federal net outlays totaled $766.318 billion in July, bringing total net outlays for the fiscal year through July to $6.284 trillion.
That represents a 5.17% increase compared to the $5.975 trillion in net outlays recorded during the same period in FY25. Total federal outlays reached $7.010 trillion during FY25.
The largest categories of federal spending so far in FY26 have been Social Security, Medicare, income security and veterans benefits, net interest on the national debt, defense, and Medicaid.
Social security accounted for $1.384 trillion in spending through July, or approximately 22% of all federal outlays. Medicare accounted for $954.52 billion, or 15.2%.
Income security and veterans benefits accounted for another $968.31 billion (15.4%), while net interest on the federal debt totaled $931.36 billion (14.8%).
Defense spending totaled $764.71 billion through July, representing 12.2% of federal outlays, while Medicaid spending reached $598.21 billion (9.5%).
In July alone, Medicare accounted for $174.25 billion in federal spending, followed by Social Security at $140.68 billion, income security and veterans benefits at $119.28 billion, net interest at $104.15 billion, defense at $86.05 billion, and Medicaid at $58.30 billion.
The CBO currently projects total federal net outlays of $7.449 trillion for FY26, increasing to $7.772 trillion in FY27 and $8.151 trillion in FY28.
Federal spending has continued to exceed revenue despite receipts also increasing compared to the same period last fiscal year.
The federal government collected $334.010 billion in net receipts during July. For the fiscal year through July, total net receipts reached $4.485 trillion.
That is a 3.19% increase from the $4.437 trillion collected during the comparable period in FY25. Total federal receipts reached $5.235 trillion durning FY25.
Individual income taxes remain the largest source of federal revenue, generating $2.369 trillion through July, or 52.8% of all federal receipts.
Social insurance and retirement taxes generated another $1.523 trillion, accounting for 33.9% of receipts.
Corporation income taxes have generated $292.91 billion so far in FY26, representing 6.5% of total receipts. Customs duties have brought in $154.47 billion (3.4%), while all other receipts accounted for $146.22 billion (3.3%).
In July, individual income taxes generated $173.27 billion, while social insurance and retirement taxes generated $139.07 billion. Corporation income taxes generated $13.57 billion during the month.
Customs duties recorded a negative $8.55 billion in July, compared with $135.69 billion collected during the comparable period of FY25. Despite the July figure, customs duties have generated $154.47 billion for the fiscal year to date.
The CBO projects federal receipts will total $5.596 trillion in FY26, $5.885 trillion in FY27 and $6.071 trillion in FY28.
While federal receipts have increased 3.19% compared with the same point in FY25, net outlays have increased by 5.17%
The difference between federal spending and revenue has contributed to the $1.799 trillion deficit accumulated through July.
The federal government’s fiscal year ends September 30, meaning the July figures cover 10 months of FY26.
Ethan Faverino is a reporter for AZ Free News. You can send him news tips using this link.
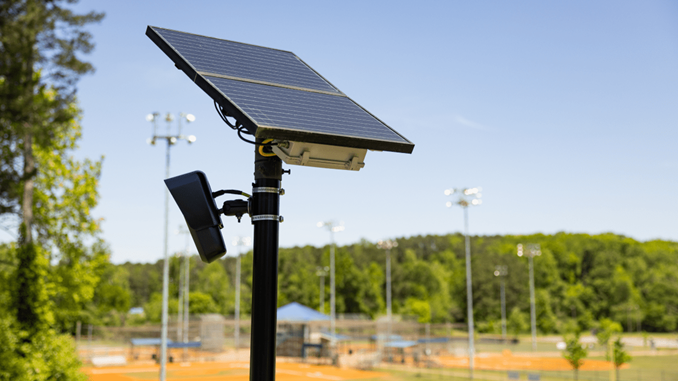
The City of Surprise announced it has suspended its use of automated license plate readers (ALPRs) after a routine audit earlier this month identified an anomaly in the system. The audit prompted an investigation into a potential violation of department policy and the placement of a Surprise police officer on administrative leave.
Surprise Police announced the suspension on Wednesday, saying the department discovered an irregularity involving its Flock automated license plate reader system. The department said the investigation remains ongoing and that additional information will be released when appropriate.
Maintaining community trust is of the utmost importance to the Surprise Police Department. That’s why we are letting you know that we discovered an anomaly in the use of the Flock automated license plate reader (ALPR) system this week that has resulted in the City suspending the… pic.twitter.com/CEOk1cDHzp
Surprise Police Chief Evan Becher stated, “Public trust is of the highest importance to the Surprise Police Department and maintaining that trust requires transparency and accountability. While we still need to complete an investigation into this irregularity, we are taking this incident very seriously. That is why we took immediate action to halt the program, investigate the issue and make the community aware of it.”
The City of Surprise began using ALPR technology more than two years ago and currently has 28 cameras operating throughout the city.
According to the City, the technology has helped law enforcement solve numerous serious crimes, including homicides, robberies, and carjackings.
The city maintains a policy governing the use of ALPR technology and conducts regular audits intended to identify potential misuse. Surprise officials said the most recent audit, functioned as intended by identifying the incident of irregular use.
Chief Becher said the city is using the incident as an opportunity to evaluate additional safeguards that could further strengthen oversight of the technology.
“This technology has proven to be extremely valuable in solving serious crimes. As we look to continue the use of this public safety tool, we want strong safeguards in place that not only alert of misuse but also prevent it,” added Becher. “Surprise Police Department is committed to ensuring enhanced protections are in place before reimplementing use of ALPR cameras.”
The Surprise suspension comes amid growing scrutiny of Flock license plate reader systems across the Valley, with several Arizona law enforcement agencies taking action involving the technology within a matter of days.
The City of Chandler announced earlier this month that it would discontinue its use of 40 fixed-camera Flock ALPRs after an audit identified what they considered an anomaly.
The incident involved an officer who misused the system to track a family member with medical issues. The officer subsequently resigned, and Chandler officials announced the Flock service would not be renewed.
In Apache Junction, a police officer resigned on August 10 following an internal investigation into allegations that he used Flock cameras to track his wife. The department announced the officer’s resignation after the investigation into his use of the system.
In Tempe, police announced on August 11 that the city would stop sharing data collected from its 33 Flock cameras with other agencies. The decision followed community concerns about privacy and recent reports involving alleged misuse of ALPR technology in other Arizona cities.
Tempe said its cameras would remain in place, but other law enforcement agencies would have to request information through the appropriate process.
“While we had previously restricted data sharing to Arizona law enforcement agencies only, this additional step will further safeguard Tempe’s data and ensure we maintain appropriate control over access,” stated Tempe Police Chief Ken McCoy.
Goodyear Police also announced this month that an officer has been placed on administrative leave following an audit of Flock ALPR use that identified potentially concerning activity.
The department said the investigation uncovered a possible violation of department policy and a possible criminal violation. The officer’s access to department computer systems was also cut off while the investigation continues.
GYPD Releases Information Regarding ALPR Use Policies and Internal Audit Process pic.twitter.com/zEAetg8iam
The developments in Surprise, Chandler, Apache Junction, Tempe, and Goodyear have all occurred within roughly one week, highlighting increasing attention being paid to how law enforcement agencies use automated license plate reader technology and the safeguards in place to prevent unauthorized access.
While law enforcement agencies have praised the technology as an important tool for investigating serious crimes, the recent incidents have raised questions about privacy, data sharing, and protections against improper use.
Ethan Faverino is a reporter for AZ Free News. You can send him news tips using this link.