Congressman Andy Biggs (R-AZ-05) introduced legislation this week aimed at increasing water supplies and accelerating infrastructure projects across the Colorado River Basin. The legislation comes as the region faces historically low reservoir levels and new reductions in Lower Basin water deliveries.
The Colorado River Basin Water Security and Infrastructure Act would direct federal resources toward water augmentation, storage, desalination, recycling, treatment, and conveyance projects while changing federal permitting requirements for certain water infrastructure.
Today, I introduced the Colorado River Basin Water Security and Infrastructure Act to expand water supplies, accelerate critical infrastructure projects, and strengthen long-term water security throughout the Colorado River Basin.
The legislation comes amid continued uncertainty over the Colorado River’s long-term management.
The seven Basin states did not reach consensus on a long-term post-2026 operating framework earlier this year. The Department of Interior subsequently finalized operating guidelines for 2027 and 2028 in August.
Those guidelines call for 1.25 million acre-feet in annual reductions to Lower Basin deliveries during each of the next two years.
“The goal of this legislation is simple: add new water, strengthen the Basin, and protect the farms, communities, and military installations that depend on the Colorado River,” stated Congressman Biggs.
Under the bill, certain water-supply projects would be exempted from requirements under the National Environmental Policy Act (NEPA).
Federal agencies would also face deadlines for reviewing project applications, including 30 days to determine whether an application is complete and 180 days to issue a final decision.
The legislation would also allow project sponsors to rely on a broader range of existing feasibility and impact studies rather than repeating previous engineering work. Major federal projects included in the legislation would receive congressional pre-authorization in an effort to shorten the time between planning and construction.
Another major component of the proposal is the creation of a Basin-wide Water Augmentation Fund. The program would provide a 2-to-1 federal cost share for eligible projects pursued by states, tribes, municipalities, utilities, and private partners.
Projects eligible for funding would include desalination, water reuse, storage and conveyance infrastructure, aquifer recharge, and salt cedar removal, among other efforts intended to increase available water supplies.
The legislation would also authorize or accelerate several large infrastructure projects throughout the Basin, including restoring the Yuma Desalting Plant to full capacity and pursuing binational desalination projects with Mexico.
Other provisions would support capturing ocean discharges in California for potential water supply, augmentation projects in Arizona and Nevada, and new Upper Basin development projects.
Biggs argued that increasing the Basin’s overall water supply should play a larger role in addressing the region’s water challenges.
“My bill offers a path forward by investing in new water, modernizing critical infrastructure, and removing unnecessary federal barriers that can delay projects for years,” said Biggs. “Increasing the amount of water available to the Basin will bolster our single-family housing market, and strengthen food security, economic security, and national security throughout the American Southwest. Congress and the people we serve cannot simply wait for relief from the drought or conserve our way out of this crisis.”
The Colorado River provides water to more than 40 million people, supports approximately 5.5 million acres of farmland, and serves 30 tribes. The river also supplies hydropower and water resources across seven U.S. states and Mexico.
Conditions across the system have deteriorated during the prolonged drought. The Bureau of Reclamation reported in August that the combined contents of Lake Powell and Lake Mead had fallen to levels not seen since Lake Powell began filling in the 1960s.
The agency said the Basin has experienced an unprecedented drought for the past 26 years, with conditions worsening in 2026.
Biggs has been involved in several other Colorado River-related efforts this year.
In March, he led Arizona Republican members of Congress in raising concerns about the Bureau of Reclamation’s draft environmental review for post-2026 operations at Lake Powell and Lake Mead.
In April, Biggs joined Arizona Congressman Greg Stanton (D-AZ-04) in urging federal officials to release funding for drought-related projects across the Basin. Biggs later partnered with Nevada Congresswoman Dina Titus in seeking additional Colorado River funding as part of an emergency funding package.
The most recent legislation places an emphasis on expanding water supplies and infrastructure throughout the Basin. Biggs said the proposal is intended to provide greater long-term certainty for communities and agriculture rather than relying solely on reductions in existing water use.
“We must think big, be leaders, and deliver real solutions that will bring relief for decades to come,” said Biggs. “I urge my colleagues to act quickly and send this legislation to the President’s desk.”
Ethan Faverino is a reporter for AZ Free News. You can send him news tips using this link.
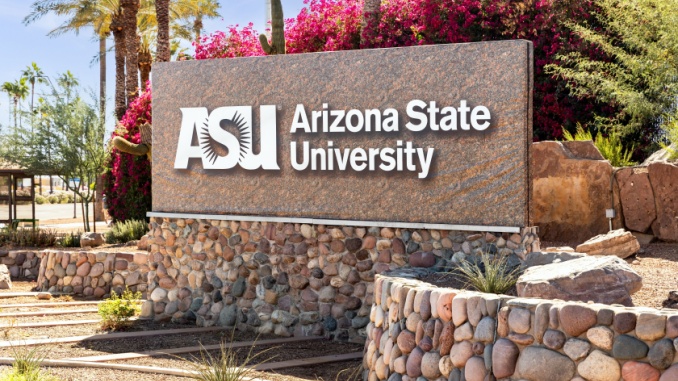
Congressmen Andy Biggs (R-AZ-05) and Eli Crane (R-AZ-02) are urging the Trump administration to select Arizona State University (ASU) as the home of a new national advanced manufacturing center aimed at strengthening military readiness and the U.S defense industrial base.
Biggs led a letter this month alongside Crane to Secretary of War Pete Hegseth supporting an ASU Research Enterprise proposal to establish the Applied Research for Manufacturing Operational Readiness Center or ARMOR Center, at ASU’s Polytechnic campus.
The U.S. Army is seeking to establish the center to help move advanced manufacturing technologies from research and development into practical military applications.
Under ASU’s proposal, the ARMOR Center would create a pipeline for developing, testing, qualifying, and scaling new manufacturing technologies before transitioning them into the Army’s Organic Industrial Base, defense contractors, and other manufacturing partners.
The center would focus on areas including additive manufacturing, artificial intelligence-enabled manufacturing, advanced composites and point-of-need production.
“Led by institutions and companies like Arizona State University, our state continues to position itself at the forefront of America’s defense industrial base,” stated Congressman Biggs. “Throughout my time in Congress, I have been pleased to support projects and initiatives that strengthen our national defense and help safeguard our citizens, freedoms, and interests.”
I recently led a letter to Secretary of War Pete Hegseth supporting Arizona State University’s application to establish the Applied Research for Manufacturing Operational Readiness Center at ASU’s Polytechnic campus in #AZ05.
Biggs said ASU is well positioned to lead the effort and expressed hope that the administration will select the university’s proposal.
In their letter to Hegseth, Biggs and Crane argued that Arizona’s existing defense industry, military installations, semiconductor investments, and research capabilities make the state a strong candidate for the center.
Arizona is home to major defense and aerospace companies including Raytheon, Honeywell Aerospace, Northrop Grumman, General Dynamics, and Boeing, along with hundreds of suppliers involved in the production of missiles, aircraft, avionics, and electronics.
Biggs and Crane also pointed to more than $210 billion in semiconductor and microelectronics investments announced in Arizona since 2020, arguing that the expanding industry could provide the Army with an established network for developing and scaling advanced manufacturing technologies.
Arizona’s military presence was also highlighted in the letter.
Fort Huachuca and Yuma Proving Ground support Army missions and testing, while Luke Air Force Base, Davis-Monthan Air Force Base, and Marine Corps Air Station Yuma provide additional military infrastructure within the state.
“Few states combine manufacturing, research, testing, and military operations in one place,” wrote Biggs and Crane.
ASU has also invested heavily in manufacturing research at its Polytechnic campus. It’s $200 million interdisciplinary Science and Technology Building 12 contains approximately $6 million in advanced manufacturing equipment, according to the letter.
The university offers bachelor’s, master’s, and doctoral degrees in manufacturing engineering and graduates more than 1,000 students annually across manufacturing, mechanical, and industrial engineering programs.
ASU has also conducted nearly $300 million in Department of War research during the past three fiscal years and leads one of the nation’s eight Microelectronics Commons hubs.
Beyond establishing the ARMOR Center, ASU’s proposal could position Arizona to host a University Affiliated Research Center (UARC) supporting the Army’s modernization and readiness efforts.
Such a center would provide the Army with a long-term research partner focused on developing and transitioning technologies needed for national defense.
Supporters contend that bringing the ARMOR Center to Arizona could strengthen domestic manufacturing capacity, expand the military’s ability to adopt emerging technologies, and reduce vulnerabilities within defense supply chains.
“A UARC in Arizona would deepen the Army’s partnership with a state that already delivers defense manufacturing, semiconductor production, federally funded research, and a skilled engineering workforce,” Biggs and Crane wrote.
Biggs and Crane asked Hegseth to give ASU’s proposal “full and fair consideration,” arguing that Arizona’s combination of defense manufacturing, military infrastructure, research capabilities and engineering workforce makes the state a natural location for the new national center.
Ethan Faverino is a reporter for AZ Free News. You can send him news tips using this link.
Small business optimism edged lower in August as owners reported weaker sales, persistent inflation pressures, and continued difficulty finding qualified workers, according to the latest data from the National Federation of Independent Business (NFIB).
The NFIB Small Business Optimism Index fell to 98.7 in August, down 1.1 points from July’s highest reading since August 2025. Despite the decline, the index remained slightly above its 52-year average of 98.
NFIB’s Uncertainty Index also declined by two points to 89 but remained well above its historical average of 68, suggesting business owners continue to face questions about economic conditions and future investment.
“Uncertainty remains elevated among small business owners as they face a mixed set of challenges with weakened sales, supply chain disruptions, and inflation pressures,” said NFIB Chief Economist Bill Dunkelberg. “While expectations for the overall economy dimmed, Main Street owners remain largely positive in the health of their own businesses.”
#NFIB's August Small Business Economic Trends report shows a slight decline in #SmallBusiness optimism and uncertainty as business owners continue to navigate inflation pressures, weakened sales, and supply chain disruptions.
In Arizona, NFIB State Director Chad Heinrich said small business owners are taking a cautious approach as they evaluate sales, hiring, and future investments.
“Arizona’s small business owners are cautious right now,” Heinrich said. “Sales are down, uncertainty is up, and owners are watching the economy closely before they commit to their next hire or investment.”
Heinrich also pointed to tax conformity measures approved by Arizona lawmakers this year, arguing that reducing tax-related uncertainty removes an additional obstacle for businesses considering expansion.
Nationally, sales showed signs of weakening during August. A seasonally adjusted net negative 9% of owners reported higher nominal sales during the previous three months, a five-point decline from July and the lowest reading since November 2025.
Expectations for better business conditions also fell five points to a net 10%, though the figure remained above the historical average of 4%.
Inflation became a greater concern during the month, with 16% of owners identifying it as their single most important problem, an increase of two points from July.
Inflation is now tied with taxes as the second-most frequently cited problem facing small businesses.
Supply chain issues also remain widespread. Sixty-two percent of small business owners said supply chain disruptions affected their operations to some degree, down only one point from July.
Despite those concerns, most owners continued to give their own businesses relatively positive remarks. Eleven percent rated the health of their business as excellent, while 57% described it as good. Another 28% rated conditions as fair, and 3% as poor.
Hiring conditions also softened in August, although businesses continue to report significant difficultly finding qualified workers.
The NFIB’s Small Business Employment Index declined 0.3 points to 101.8 but remained above the 2025 average of 101.2 and its historical average of 100.
Thirty-five percent of owners reported job openings they could not fill, one point lower than July but still 11 points above the historical average.
Among the 56% of businesses that were hiring or attempting to hire, 82% reported receiving few to no qualified applicants.
Thirty-one percent of owners reported openings for skilled workers, while 13% had openings for unskilled positions.
Hiring plans also cooled. A seasonally adjusted net 17% of owners said they plan to create new jobs over the next three months, down three points from July.
#NFIB's August Jobs Report found that small business hiring and job creation plans eased as summer came to a close, though many owners still struggle to find qualified workers. #SmallBusiness#JobsReport
“Small businesses are slowing down their hiring efforts as the summer comes to an end, with fewer owners reporting job openings or plans to create new positions,” said Dunkelberg. “The pressure to offer competitive wages is still high, but it’s no longer a top challenge for most Main Street employers.”
Labor pressures nevertheless remain elevated compared with historical levels. Twenty-three percent of owners identified labor quality or availability as their top operating problem, down four points from July but 11 points above the historical average.
Labor costs, meanwhile, were identified as the top problem by 7% of owners, the lowest level since March 2021.
Compensation increases remained steady, with a seasonally adjusted net 31% of owners reporting they raised pay in August. A net 18% plan to increase compensation during the next three months.
The August figures present a mixed picture for small businesses heading into the fall: optimism remains slightly above its long-term average and most owners continue to view their individual businesses positively, but weaker sales, elevated uncertainty, inflation, and persistent hiring difficulties continue to weigh on Main Street.
Ethan Faverino is a reporter for AZ Free News. You can send him news tips using this link.
The U.S. national debt has surpassed $40 trillion, adding more than $2.6 trillion over the past year as federal borrowing and interest costs continue to climb.
The Joint Economic Committee released its latest Monthly Debt Update on September 8, showing the total gross national debt stood at $40.10 trillion as of September 3.
That represents an increase of $2.67 trillion from approximately $37.43 trillion one year earlier and an increase of $11.68 trillion over the past five years.
Of the current debt, approximately $32.42 trillion is held by the public, while another $7.68 trillion consists of intergovernmental debt.
Over the past year, the national debt increased at an average rate of approximately $7.35 billion per day, $306.4 million per hour, $5.11 million per minute, and $85,112 per second.
The committee calculated that the increase over the past year alone amounts to approximately $7,806 per person and $19,804 per household. The total national debt now equals approximately $117,279 per person or $297,522 per household.
If the average daily rate of debt growth recorded over the past three years continues, the committee projects the national debt will reach $41 trillion around January 16, 2027.
At that pace, the federal government would add roughly another $1 trillion to the debt every 151 days.
As of Sept 03, total gross national debt is $40.10T. Relative to 1yr ago, total gross national debt is $2.67T higher; relative to 5yrs ago, it is $11.68T higher. Over the past year, the rate of increase averaged $7.35B/day, $306.40M/hour, $5.11M/minute, or $85,111.72/second.…
— Joint Economic Committee Republicans (@JECRepublicans) September 8, 2026
The report also highlighted the growing cost of servicing the debt as interest rates remain substantially higher than they were several years ago.
As of August, the average interest rate on the federal government’s marketable debt stood at 3.475% compared with 3.415% one year earlier and 1.458% five years ago.
Higher rates increase the government’s borrowing costs as existing securities mature and the Treasury issues new debt.
The Congressional Budget Office forecasts net interest will account for 13.95% of federal outlays in Fiscal Year 2026, rising to 14.25% in Fiscal Year 2027, and 14.94% in Fiscal Year 2028.
The federal government also paid approximately $294.76 billion in interest to trust funds during the previous 12 months, averaging $24.56 billion per month.
Treasury notes continue to make up the largest portion of publicly held debt. As of August, approximately $16.21 trillion, or 50.02% is held in notes, while $7.25 trillion is in Treasury bills and $5.51 trillion is in bonds. Another $3.44 trillion is held in other securities.
About 33% of publicly held marketable debt is expected to mature within 12 months, according to the most recent data from the third quarter of FY26. The average maturity of the debt stood at 71 months as of June compared with 72 months a year earlier and 69 months in June 2021.
Despite the growing debt load, Treasury auctions continue to show demand for U.S. government securities. As of August, the bid-to-cover ratio stood at 2.97 for four-week Treasury bills, 2.53 for 10-year notes, and 2.39 for 30-year bonds.
A ratio of 2 or higher is generally considered an indication of strong demand.
The latest figures come as federal policymakers face the combination of a rapidly growing debt burden, elevated borrowing costs, and a significant portion of existing debt scheduled to mature in the near future.
Ethan Faverino is a reporter for AZ Free News. You can send him news tips using this link.
Arizona State Representative Walt Blackman (R-LD7) is calling on Americans to remember the courage, sacrifice, and national unity that followed the September 11 terrorist attacks.
Blackman, a retired U.S. Army combat veteran who served for 21 years, reflected on his own experience on September 11, 2001, when he was a young Army tank commander stationed at Fort Hood, Texas.
“Some dates are remembered. Others divide history into a before and after. September 11 did both,” said Blackman.
The September 11 attacks killed 2,977 people after 19 al-Qaeda terrorists hijacked four commercial airplanes.
Two were flown into the World Trade Center towers in New York City, while another struck the Pentagon. Passengers and crew members aboard United Airlines Flight 93 fought back against the hijackers before the plane crashed near Shanksville, Pennsylvania.
Blackman said that, like millions of Americans watching the attacks unfold, he could not have known at the time how dramatically the events of that morning would reshape the country or the lives of those serving in the military.
Rep. Walt Blackman Honors Victims, First Responders and Service Members on 25th Anniversary of September 11 Calls on Americans to remember the courage and unity that followed one of the darkest days in our nation’s history
In his statement, Blackman honored those killed in the attacks as well as the firefighters, police officers, and emergency personnel who responded to the scenes in New York and the Pentagon. He also recognized the passengers and crew aboard Flight 93 who resisted the hijackers.
“We remember the 2,977 innocent people whose lives were taken in New York City, at the Pentagon and near Shanksville, Pennsylvania,” Blackman said. “We honor the firefighters who climbed the stairs while others were trying to escape, the police officers and emergency personnel who ran toward danger, and the passengers and crew aboard Flight 93 who fought back and sacrificed themselves to save others.”
Blackman also directed attention toward the military personnel and their families who carried the burden of the wars that followed the attacks.
“We also remember the service members and military families who carried the weight of the wars that followed,” Blackman said. “Many never returned home. Others came home carrying wounds, some visible and others unseen.”
Blackman’s own military career included six overseas deployments, with combat deployments to Iraq and Afghanistan as well as service in Kosovo and Kuwait.
Twenty-five years after the attacks, Blackman said Americans should remember not only the lives lost but also the sense of unity that emerged across the country in the aftermath.
He noted that political divisions existed before September 11 and remain prevalent today, but argues that Americans put many of those differences aside following the attacks.
“America was politically divided before September 11, just as we are divided today,” said Blackman. “But when our nation was attacked, Americans came together. We did not ask whether the person standing beside us was a Republican or a Democrat. We stood together as Americans.”
Blackman said the anniversary should serve as an opportunity to remember the courage and compassion demonstrated under the aftermath of the attacks and to continue supporting first responders, veterans, and the families of those who died.
“We honor those we lost by remembering their names, supporting our first responders and veterans, standing with their families, and refusing to allow political division to outweigh our shared love of country,” said Blackman. “May God bless the families of the fallen, our first responders, our service members and the United States of America.”
Ethan Faverino is a reporter for AZ Free News. You can send him news tips using this link.