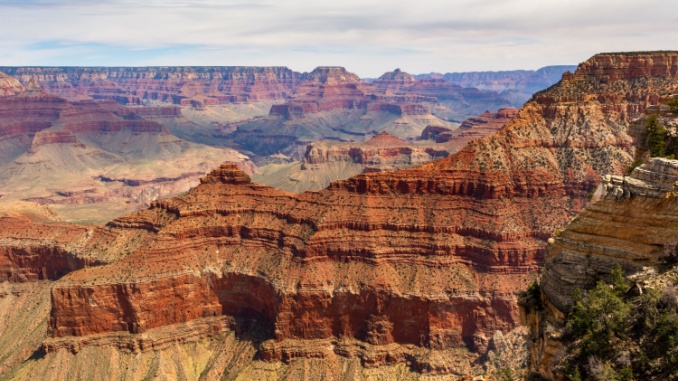
The U.S. Small Business Administration (SBA) announced the availability of low-interest federal disaster loans for small businesses and private nonprofit organizations experiencing financial losses from flash flooding at Grand Canyon National Park earlier this year.
The disaster declaration, issued October 13, follows a request from Governor Katie Hobbs on October 8 and provides assistance to eligible organizations affected by flooding that occurred between August 29 and September 3.
The declaration covers five Arizona counties, including Coconino, Gila, Mohave, Navajo, and Yavapai, as well as Kane and San Juan Counties in Utah.
Through the SBA’s Economic Injury Disaster Loan (EIDL) program, eligible small businesses, small agricultural cooperatives, and private nonprofit organizations, including faith-based organizations, can apply for loans of up to $2 million to help offset financial losses directly related to the flooding.
The loans are intended to provide working capital for operating expenses that businesses and nonprofits would have otherwise been able to cover had the disaster not occurred. Eligible expenses include fixed debts, payroll, accounts payable, and other financial obligations.
Businesses and nonprofits may qualify for assistance even if they did not sustain physical property damage.
Interest rates are as low as 4% for businesses and 3.625% for private nonprofit organizations, with repayment terms extending up to 30 years. Interest does not accrue, and payments are not required until 12 months after the first loan disbursement.
The SBA determines loan eligibility, amounts, and repayment terms based on each applicant’s financial condition.
“SBA loans help eligible small businesses and private nonprofits cover operating expenses after a disaster, which is crucial for their recovery,” stated Chris Stallings, associate administrator of the SBA’s Office of Disaster Recovery. “These loans not only help business owners get back on their feet but also play a key role in sustaining local economies in the aftermath of a disaster.”
Congressman Eli Crane (R-AZ-02), whose congressional district includes Grand Canyon National Park, also announced the availability of the disaster assistance, encouraging affected businesses and nonprofit organizations to explore the federal program.
Following the devastating flash floods at @GrandCanyonNPS, @SBAgov has approved a disaster declaration for several counties.
If your small business suffered economic losses as a result, I encourage you to see if you qualify for a low-interest loan: pic.twitter.com/cYlcE7aMYg
“If your business or nonprofit experienced challenges caused by the flooding, I encourage you to review this avenue of assistance from the SBA,” stated Crane. “The EIDL program offers eligible applicants low-interest loans, which can help offset losses from this tragic disaster.”
Crane also emphasized the importance of continued recovery efforts for Grand Canyon communities and highlighted recent congressional action involving the North Rim Restoration Act of 2025.
“Although it’s been a difficult period for park staff, gateway communities, and local businesses, my team and I are committed to doing everything we can to assist with the recovery effort,” added Crane. “Between this week’s announcement and recent Senate action on the North Rim Restoration Act of 2025, I’m hopeful we can help deliver long-term stability to this cherished place.”
Eligible businesses and nonprofit organizations have until July 13, 2027, to submit economic injury disaster loan applications.
Ethan Faverino is a reporter for AZ Free News. You can send him news tips using this link.
Federal interest payments could consume more than half of federal tax revenue by 2036, as rising borrowing costs and mounting national debt threaten the nation’s long-term fiscal stability, according to a new report from Congress’ Joint Economic Committee (JEC).
The report, titled Federal Interest Spending Could Now Exceed Half of Available Tax Receipts in Ten Years, warns that higher interest rates could significantly increase the federal government’s debt-servicing costs, placing additional pressure on the federal budget over the next decade.
According to the JEC, net interest payments could account for 55.4% of federal receipts excluding payroll taxes by 2036 under a higher-interest-rate scenario, compared to 38.1% under the Congressional Budget Office’s (CBO) baseline projections.
The findings come as the national debt has surpassed $40 trillion, with approximately $32.4 trillion held by the public at the end of fiscal year 2026.
Interest payments could consume 55 percent of federal receipts excluding payroll taxes by 2036.Under CBO's higher-rate scenario, net interest spending would reach 55.4 percent of available tax receipts by 2036, compared with 38.1 percent under CBO's baseline projection. Even…
— Joint Economic Committee Republicans (@JECRepublicans) October 15, 2026
“We are rapidly approaching a fiscal reality where more than half of federal receipts outside of payroll taxes could go toward servicing our debt by 2036,” stated JEC Chairman and Arizona Congressman David Schweikert (R-AZ-01).
“Under this higher interest rate scenario, we could spend $23 trillion on interest alone over the next decade. That is spending not on Social Security, not on Medicare, not on national defense, but simply paying for yesterday’s borrowing,” Schweikert added.
According to the JEC, the yield on 10-year Treasury notes increased from approximately 4.2% in February to 5.2% on October 1, 2026. The increase reflects higher federal borrowing costs, raising concerns that interest rates could remain above earlier projections and place additional pressure on the federal budget.
The report draws on a recent CBO analysis examining how higher interest rates could affect federal deficits, debt, and borrowing costs between 2026 and 2036.
Under a scenario in which interest rates remain 1.5 percentage points above the CBO’s February 2026 baseline projections, cumulative federal deficits would increase by approximately $6 trillion over the next decade.
Even under a less severe scenario in which interest rates remain 0.5 percentage points above the CBO’s baseline projections, cumulative federal deficits would increase by approximately $1.9 trillion through 2036, highlighting the federal government’s growing sensitivity to borrowing costs.
Of the projected $6 trillion increase under the higher-rate scenario, approximately $4.9 trillion would result directly from higher interest costs, while an additional $1.1 trillion would come from borrowing needed to finance those increased payments.
The JEC estimates that total net interest spending could reach $23.2 trillion through 2036 under the higher-rate scenario, compared to approximately $17.2 trillion under the CBO’s baseline projections.
The report also highlights the federal government’s exposure to rising borrowing costs as existing debt matures. Approximately $10 trillion in marketable Treasury debt is expected to mature within the next year, potentially requiring refinancing at higher interest rates.
Under the higher-rate scenario, annual federal interest spending would grow by an average of 10.8% over the next decade, significantly exceeding projected annual economic growth of 3.9%.
“When interest costs are growing nearly three times faster than the economy, the math becomes impossible to ignore,” stated Schweikert. “Every dollar we borrow makes us more vulnerable to higher interest rates and leaves fewer resources for everything else. We are approaching a debt spiral that could become mathematically impossible to escape and the window to avert a full-blown fiscal crisis is rapidly closing.”
The CBO further estimates that debt held by the public could reach 133.1% of gross domestic product (GDP) by 2036 under the higher-rate scenario, compared to 120.2% under its baseline projections.
The JEC warned that without significant reductions in federal spending, rising interest obligations could leave Congress facing increasingly difficult decisions involving higher taxes, reduced government spending, or additional borrowing to meet existing financial obligations.
Ethan Faverino is a reporter for AZ Free News. You can send him news tips using this link.
Americans are expected to spend $13.5 billion on Halloween this year, surpassing last year’s record of $13.1 billion, according to the National Retail Federation’s (NRF) annual consumer survey conducted by Prosper Insights & Analytics.
The survey found that 74% of consumers plan to celebrate Halloween this year, compared to 73% in 2025 and 68% in 2019, reflecting the holiday’s continued popularity among American households.
Despite increased spending, consumers are expected to remain mindful of rising costs, with average spending projected at $115.14 per person, slightly above last year’s $114.45.
“Consumers continue to make Halloween a spending priority, but they are also approaching the season with affordability in mind,” stated NRF Vice President of Industry and Consumer Insights Allison Zeller.
“For more than two decades, NRF’s Halloween survey has tracked how consumers celebrate the holiday, and this year’s results show that shoppers are being thoughtful and strategic, looking for ways to maximize value throughout the season,” added Zeller.
🎃 Halloween spending is expected to reach $13.5 billion this year, with consumers planning to spend an average of $115 on costumes, candy, decorations and more. https://t.co/5ABujtWJNzpic.twitter.com/6ozeoGIFTf
According to the survey, nearly half of consumers (49%) planned to begin their Halloween shopping in September or earlier, an increase from 34% in 2016.
Among those shopping early, 42% cited their enthusiasm for the fall season, while 34% said Halloween was one of their favorite holidays. Another 23% said they began shopping early to spread out their expenses, while 21% were motivated by discounts and promotions.
Consumers are also adjusting their purchasing habits in response to higher prices. Nearly one-third (31%) said they would compare prices between retailers if Halloween merchandise costs more than expected, while 26% would seek coupons or sales. Another 34% plan to purchase items that can be reused in future years or repurposed for other occasions.
Costumes are expected to account for the largest share of Halloween spending at $4.4 billion, followed by decorations at $4.3 billion, candy at $4.1 billion, and greeting cards at $800 million.
Of the projected costume spending, consumers are expected to spend approximately $2 billion on adult costumes, $1.5 billion on children’s costumes, and $920 million on pet costumes.
Candy remains the most popular Halloween purchase, with 96% of shoppers planning to buy sweets. Additionally, 78% plan to purchase decorations, 71% expect to buy costumes, and 42% plan to purchase greeting cards.
Discount stores remain the leading shopping destination for Halloween merchandise, attracting 39% of consumers, followed by specialty Halloween and costume stores at 32% and online retailers at 27%.
Local and small businesses are also attracting more Halloween shoppers, with 13% planning to make purchases at these establishments, nearly double the 7% reported in 2016.
The survey also highlighted the growing role of artificial intelligence in consumer shopping habits.
Nearly half of consumers (47%) reported using AI platforms or tools to assist with Halloween shopping, including brainstorming costume and decoration ideas and researching potential purchases.
Online searches remain the most popular source of Halloween costume inspiration at 32%, although that figure declined from 37% last year and reached its lowest level in a decade.
The most common Halloween activities this year include handing out candy (61%), dressing in costumes (50%), decorating homes or yards (42%), carving pumpkins (42%), and watching scary movies (42%).
Ethan Faverino is a reporter for AZ Free News. You can send him news tips using this link.
The National Federation of Independent Business (NFIB) announced its endorsement of six Arizona congressional candidates ahead of the November general election, citing their positions on policies affecting small businesses and economic growth.
The endorsements include two Republican candidates seeking seats in the U.S. House of Representatives and four incumbent Republican congressmen seeking reelection.
The organization endorsed:
Jay Feely (AZ-01)
Eli Crane (AZ-02)
Mark Lamb (AZ-05)
Juan Ciscomani (AZ-06)
Abe Hamadeh (AZ-08)
Paul Gosar (AZ-09)
“Arizona small businesses are the foundation of our state’s economy,” stated NFIB Arizona State Director Chad Heinrich. “The candidates we have endorsed have a deep understanding of the small business landscape and will be reliable pro-Main Street voices in Congress. We are eager to work with them to ensure that Arizona small businesses can continue to effectively operate and create jobs.”
The NFIB regularly participates in federal and state policy debates involving taxation, government regulations, labor requirements, and other issues affecting business owners.
The organization said its endorsements reflect its assessment of the candidates’ commitment to advancing policies that support small businesses.
The endorsements were issued through NFIB FedPAC, the organization’s political action committee, which is funded through voluntary contributions from NFIB members beyond their membership dues. According to NFIB, endorsement decisions are made through a member-driven grassroots evaluation process.
“We are proud to endorse a slate of candidates who have demonstrated a steadfast commitment to advancing the interests of Arizona small businesses,” stated Louis Bertolotti, NFIB Political Director. “Small business owners deserve representatives who understand the issues that matter to them and will consistently advocate for policies that promote economic growth. We look forward to working with these pro-small business leaders in Washington.”
The congressional endorsements came the same day the NFIB’s Arizona political action committee announced its support for 52 candidates seeking state offices, reflecting the organization’s involvement in both state and federal elections ahead of November.
American consumer spending increased in August as inflation remained above the Federal Reserve’s 2% target and the personal savings rate declined, according to the latest economic updates released by Congress’ Joint Economic Committee (JEC).
The JEC’s August Monthly Expenditures Update reported that the Personal Consumption Expenditures (PCE) price index, a key inflation measure used by the Federal Reserve, increased 0.31% from July to August.
Core PCE inflation, which excludes the more volatile food and energy categories, increased 0.25% during August.
Over the past year, headline PCE inflation reached 3.42%, remaining above the Federal Reserve’s annual target of 2%. Core PCE inflation registered 3.01% over the same period.
Despite continued inflationary pressures, consumer spending increased during August. Inflation-adjusted personal consumption expenditures rose 0.55%, representing an increase of approximately $92.82 billion.
Spending on goods accounted for much of the increase, rising 1.33%, or $76.44 billion, while spending on services increased 0.20%, or $22.27 billion. Within the goods category, spending on durable goods rose 1.93%, while spending on nondurable goods increased 1.02%.
Several major household expenditure categories also recorded increases during August.
Spending on gasoline and other energy goods increased 4.32% from July and 23.55% compared to August 2025. Motor vehicles and parts expenditures rose 2.53% for the month, while transportation services increased 1.66%.
Housing and utilities remained one of the largest household spending categories, accounting for approximately $4 trillion in annualized expenditures, an increase of 4.51% from the previous year. Health care expenditures reached approximately $3.86 trillion, representing a 6.76% annual increase.
July-Aug, headline PCE inflation was 0.31%. Core PCE inflation, which excludes food & energy prices, was 0.25%. Headline personal income increased 0.24%, or $66.65B, while real disposable personal income/capita increased 0.05%, meaning prices rose faster than after tax income.…
— Joint Economic Committee Republicans (@JECRepublicans) September 30, 2026
Meanwhile, the report indicated that Americans saved a smaller portion of their income during August.
The personal savings rate declined by 0.5 percentage points to 4.1%, while personal income increased 0.24%, or approximately $66.65 billion.
Real disposable personal income per capita declined 0.05%, indicating that inflation-adjusted after-tax income fell slightly during the month.
The JEC also released its third estimate of second-quarter gross domestic product (GDP), reporting that the U.S. economy expanded at an annualized inflation-adjusted rate of 2.22%.
The latest estimate represents an upward revision of 0.74 percentage points from the previous estimate.
Current-dollar GDP increased at an annualized rate of 8.49%, with the annualized dollar value of economic output reaching approximately $32.56 trillion during the second quarter, up $656.8 billion from the first quarter.
Consumer spending was a major contributor to economic growth during the quarter, adding approximately 2.5 percentage points to real GDP growth.
Nonresidential fixed investment contributed another 1.2 percentage points, while changes in private inventories and net exports reduced overall growth by approximately 0.5 and 1.1 percentage points, respectively.
The updated figures show that consumer spending continued to support economic activity during the second quarter and into August, even as inflation remained elevated and households devoted a smaller share of their income to savings.
Ethan Faverino is a reporter for AZ Free News. You can send him news tips using this link.
A new study from the Joint Economic Committee (JEC) found that household inflation has been lower this presidential term than the last.
The JEC published a data brief on Thursday that reflected that the average household faced $2,881 less in additional costs from rising prices during the first 20 months of President Donald Trump’s second term — from January 2025 through August 2026 — than the first 20 months of former President Joe Biden’s term — from January 2021 through August 2022.
That cost difference amounts to an average reduction of nearly 41%.
“The comparison does not mean prices declined during President Trump’s second term,” stated the JEC. “Rather, the analysis finds that the cumulative increase in household costs was substantially smaller than during the comparable period under President Biden.”
During the first 20 months of Biden, the average American household experienced $7,081 in additional costs. Arizona was above this average. The average Arizona household experienced $8,427 in additional costs during that same time frame.
During the first 20 months of Trump, the average American household experienced $4,200 in additional costs. Arizona was below this average. The average Arizona household experienced $4,000 in additional costs during that same time frame, a reduction of $4,427 from the prior administration.
In Arizona, that cost difference between administrations amounts to an average reduction of nearly 52%.
In December 2025, the White House released an analysis reflecting that states experienced a difference in year-over-year inflation based on the political affiliations of their leadership. Conservative-leaning states experienced an overall average 2.5% inflation rate, whereas liberal-leaning states experienced an overall average 3% inflation rate.
Conservative states experienced an average 3.4% year-over-year inflation rate for housing, 2.5% for food and beverage, 3.5% for energy, and 0.7% for transportation, compared to liberal states experiences of 3.6% inflation rate for housing, 2.7% for food and beverage, 5.2% for energy, and 2.5% for transportation.
The consistent rates of heightened inflation rates under liberal governance remained true when distinguishing states based on the political affiliations of the governor and legislature, and state control.
States led by conservative governors experienced 2.3% year-over-year inflation rate overall, 3.2% inflation rate for housing, 2.4% inflation rate for food and beverage, 2.9% inflation rate for energy, and 0.6% inflation rate for transportation.
States led by liberal governors experienced a 3% inflation rate overall, 3.7% inflation rate for housing, 2.7% inflation rate for food and beverage, 5.3% inflation rate for energy, and 2.1% inflation rate for transportation.
States with conservative legislatures experienced a 2.4% inflation rate overall, 3.3% inflation rate for housing, 2.4% inflation rate for food and beverage, 2.9% inflation rate for energy, and 0.6% inflation rate for transportation.
States with liberal legislatures experienced a 3% inflation rate overall, 3.6% inflation rate for housing, 2.7% inflation rate for food and beverage, 5.1% inflation rate for energy, and 2.5% inflation rate for transportation.
States in which the legislature had neither a conservative or liberal majority experienced a 3.1% inflation rate overall, 4.5% inflation rate for housing, 2.7% inflation rate for food and beverage, 7.7% inflation rate for energy, and 0.9% inflation rate for transportation.
States defined as under conservative control experienced a 2.3% inflation rate overall, 3.3% inflation rate for housing, 2.4% inflation rate for food and beverage, 2.9% inflation rate for energy, and 0.6% inflation rate for transportation.
States defined as under liberal control experienced a 3% inflation rate overall, 3.6% inflation rate for housing, 2.7% inflation rate for food and beverage, 5.4% inflation rate for energy, and 2.7% inflation rate for transportation.
States defined as under neither conservative nor liberal control experienced a 2.8% inflation rate overall, 3.8% inflation rate for housing, 2.7% inflation rate for food and beverage, 4.7% inflation rate for energy, and 0.7% inflation rate for transportation.
Arizona was defined as having a conservative affiliation. The state experienced a year-over-year inflation rate of 2.6% overall, 1.8% for housing, 2.6% for food and beverage, 2.3% for energy, and 1.4% for transportation.
The city of Phoenix was also included as a major metro area for that analysis, but it was defined based on the state’s assigned affiliation of “conservative.” The city experienced a year-over-year inflation rate of 1.4% overall, -0.1% for housing, 1.1% for food and beverage, 6.7% for energy, and 0.8% for transportation.
AZ Free News is your #1 source for Arizona news and politics. You can send us news tips using this link.