Arizona’s unemployment rate has now hit a new high following the COVID-19 pandemic.
The state’s unemployment rate neared 5% according to a new data analysis report from the Common Sense Institute of Arizona (CSI). Based on this newly calculated rate, Arizona has the 12th-highest unemployment rate in the nation.
Unemployment hit 4.8% in May, with CSI saying broader data indicators have revealed the state’s labor market to be cooling despite job growth.
The addition of 2,000 non-farm jobs in May put Arizona at 30th for national job growth. Overall, the nation experienced growth with the addition of 172,000 jobs.
As for job growth year-over-year, Arizona added over 21,200 jobs. That qualified the state as the 10th best in the nation for job growth year-over-year.
Mining jobs increased by about 1,300 over the past year. CSI attributed this growth to the increased demand for copper by electric vehicles, artificial intelligence technology, and data centers.
Manufacturing jobs also increased by 500 over the past year. Trade, transportation, and utility jobs declined by 1,600 over the past year.
Arizona’s labor participation also hit a post-pandemic milestone. The state’s labor force participation rate fell just below 61 percent: the lowest level seen since 2020. Last May, the labor force participation rate was over 62 percent.
Along with rising unemployment and compressed labor participation, Arizona’s private-sector wages increased by over three percent over the year to $35.78. However, that total lags behind the national average of $37.53.
Arizonans may have felt these changes to Arizona’s employment climate more acutely due to major year-over-year changes with state spending.
CSI attributed the state’s budget shortfall to overspending.
Another recent analysis released earlier this month by CSI found that the state budget has experienced rapid growth over the past decade.
In just 10 years, the state budget doubled and now amounts to more than 10% of the state’s gross domestic product.
Per CSI, spending pressures have remained elevated despite normalized revenue growth.
Some items that CSI said to blame were the disparities between Arizona Health Care Cost Containment System (AHCCCS) enrollment and member costs, elevated demands from the Development Disabilities Program (DDP), and federal payment error rates impacting Supplemental Nutrition Assistance Program (SNAP) obligations.
AHCCCS enrollment fell by about 10% (over 200,000 people) but average per-member costs increased by 14%.
DDP was projected to require an additional $400 million in state spending by next year.
And the state may have to cover $300 million in annual SNAP cost-sharing obligations should federal payment error rates fail to be reduced in the near future.
Total state spending reached over $70 billion in the 2026 fiscal year, and estimates projected spending to approach $75 billion in the 2027 fiscal year. Of the 2026 fiscal year total state spending, close to $50 billion is expected to come from non-appropriated funds.
CSI found that spending not subject to regular legislative appropriations has grown by more than 150% over the past decade, though appropriated spending grew by about 100%.
AZ Free News is your #1 source for Arizona news and politics. You can send us news tips using this link.
The U.S. House of Representatives has unanimously passed H.R. 7396, the Native American Entrepreneurial Opportunity Act, a bipartisan measure aimed at strengthening Small Business Administration (SBA) outreach and support for Tribal entrepreneurs across the United States.
The legislation, led by a bipartisan coalition in Congress, seeks to formally establish and codify the Office of Native American Affairs (ONAA) within the SBA by amending the Small Business Act.
The goal is to improve coordination, accountability, and targeted support for Native American and native Hawaiian business owners who often face structural barriers in accessing federal resources.
The bill was introduced by a bipartisan group of lawmakers including Rep. Eli Crane (R-AZ-02), alongside Rep. Shanice Davids (D-KS-03), Rep. Jake Ellzey (R-TX-06), and Rep. Kelly Morrison (D-MN-03). The measure passed the House with unanimous support after previously clearing the chamber in the last Congress with strong bipartisan backing before stalling in the Senate.
If enacted, the legislation would formally embed the ONAA within the Small Business Administration and assign its responsibility for expanding access to entrepreneurial development programs, contracting opportunities, and capital resources for Tribal communities.
This evening, the House unanimously passed the Native American Entrepreneurial Opportunity Act to strengthen @SBAgov outreach to Tribal entrepreneurs.
The office would also be tasked with improving coordination with other federal agencies and increasing education about available programs for Native entrepreneurs.
Tribal business owners, particularly those operating on reservations, often face unique challenges including complex tax structures, regulatory barriers, lending difficulties, and questions surrounding property rights.
Supporters of the legislation argue that these issues have been compounded by inconsistent outreach and limited access to federal small business programs.
By codifying the Office of Native America Affairs into federal law, the bill also strengthens congressional oversight by requiring annual reports to Congress detailing outreach efforts, consultations with Tribal governments, training initiatives, and the number of entrepreneurs served.
“I’m proud to be part of the bipartisan coalition working to improve and expand SBA outreach to Tribal communities. As the representative of over half of Arizona’s tribes, I’m focused on solutions to help expand economic growth throughout rural Arizona,” stated Rep. Crane. “I’m grateful to Rep. Davids for her leadership, as well as Reps. Ellzey and Morrison for their support of this important bill. I urge my colleagues in the Senate to quickly take up and pass this measure.”
Ethan Faverino is a reporter for AZ Free News. You can send him news tips using this link.
U.S. Rep. David Schweikert (R-AZ01), chairman of the Joint Economic Committee (JEC), warned that the United States faces growing fiscal risk unless Congress acts sooner to stabilize the federal debt-to-GDP ratio.
Schweikert sent the committee’s latest Views and Estimates letter to House Budget Committee Chairman Jodey Arrington in a letter earlier this month.
“There is great uncertainty about when and how the debt will switch from sustainable, business as-usual, to an unsustainable, market-unraveling nightmare,” Schweikert wrote. “Every year we wait to change course increases leverage, and the higher the debt-to-GDP ratio the easier it is for bad headwinds—such as crisis spending or interest rate fragility—to lock us into a debt spiral. In short, allowing the debt burden to increase is a levered bet, and the downside risks are already enormous.”
JEC Chairman @RepDavid sent @HouseBudgetGOP Chairman @RepArrington the latest Views & Estimates. “There is great uncertainty about when & how the debt will switch from sustainable, business as-usual, to an unsustainable, market-unraveling nightmare. https://t.co/pPMp4K17EP
— Joint Economic Committee Republicans (@JECRepublicans) June 8, 2026
The committee’s Republican staff found that rising federal debt is structurally unsustainable and that stabilizing the debt-to-GDP ratio will require large early policy changes. The letter states that delaying action materially increases the risk of severe economic and financial consequences.
According to the letter, federal debt has recently reached 100 percent of gross domestic product, meaning the federal debt is now roughly the size of the economy’s total annual output. The Congressional Budget Office projects debt held by the public will reach 118 percent of GDP by 2035, 142 percent by 2045, and 172 percent by 2055. Treasury projections cited in the letter are higher, estimating 129 percent by 2035, 183 percent by 2045, and 245 percent by 2055.
The JEC letter describes the current debt path as a “levered bet on stability” that depends on avoiding major crises requiring substantial fiscal headroom and on future interest rates remaining favorable relative to economic growth. The letter warns that the damage to the nation’s fiscal position and status as a world power could be “catastrophic and irreversible” if those conditions deteriorate.
The committee cited estimates from the Committee for a Responsible Federal Budget indicating that a fiscal adjustment of about $9.5 trillion over ten years would be needed to stabilize the debt-to-GDP ratio at about 100 percent. The JEC letter used a similar ballpark estimate of about $9.2 trillion to close the primary deficit over a ten-year window, while noting that the exact adjustment would depend on interest rates, economic growth, the timing of policy changes, and the path of the primary deficit.
“In any case, these are magnitudes of adjustment virtually absent from current policy debates,” the letter states.
The letter recommended reforms in Medicare, international taxation, and immigration that it estimated would produce about $3.6 trillion in deficit reduction over ten years, or roughly 40 percent of the adjustment identified as necessary to stabilize the debt-to-GDP ratio.
The largest proposed savings would come from Medicare Advantage reform. The letter states that Medicare Advantage now covers 55 percent of all Medicare beneficiaries and that flawed payment policies, excessive coding practices, insufficient enforcement, and federal inaction have driven up costs. According to the JEC, Medicare Advantage beneficiaries are now estimated to cost roughly 14 percent more than they would under traditional Medicare, amounting to an estimated $76 billion in excess federal spending in 2025.
The letter cites H.R. 3467, the Better Medicare Act, as a proposal to realign Medicare Advantage incentives. The JEC estimated the legislation would reduce federal spending by approximately $1.8 trillion over ten years.
In a Fox Business appearance posted to X by Schweikert’s office, Schweikert described what he called “institutional design fraud,” citing his team’s investigations into New York and California “where they’re exploiting part of the Medicaid system for billions and billions and billions of dollars.”
Federal prosecutors say a $30 million Medicaid scheme meant for children’s mental health services helped pay for a fleet of luxury vehicles. That is bad actor fraud.
But the real bleeding is coming from New York and California exploiting parts of Medicaid for billions and… pic.twitter.com/jFyGJr3JAC
“If New York actually had the same cost in their Medicaid system,” he continued, “it would be a $50 billion savings a year if they had the same costs as other states. That’s actually where the tremendous amount of money is, because remember, we’re borrowing about a million dollars every 15 seconds. So, the scale is what’s just so hard to get your head around.”
The committee also recommended a border adjustment tax policy, which would tax business income based on where products are sold rather than where they are produced. Under the proposal, export receipts would be excluded from the tax base and import deductions would be disallowed. The JEC estimated the policy could raise approximately $1.5 trillion over ten years.
On immigration, the committee recommended shifting employment-based admissions toward higher-producing applicants through a points-based, industry-targeted framework. The letter states that an aging population and a shrinking pool of younger workers are reducing the labor force needed to grow the economy and service the debt. The JEC estimated that such a reform could produce a net fiscal benefit of $335 billion over ten years and $1.34 trillion over twenty years, assuming annual immigration remains at current levels.
Schweikert has raised the alarm regarding demographic decline as a driver of fiscal collapse, citing three unassailable facts: “debt, deficits and demographics,” in March 2025.
The letter also credited H.R. 1, commonly known as the One Big Beautiful Bill Act, with pro-growth tax provisions. The JEC said policymakers should redirect their focus toward “transparently pro-growth reforms” and cited federal land sales, reforms of the Jones Act, and policy related to port automation as examples of areas that could support growth.
Schweikert’s letter concluded that growth alone should not be counted on to resolve the federal government’s fiscal problems.
“I have highlighted fiscal reforms that would bring us about 40 percent of the way to stability of the debt-to-GDP ratio,” Schweikert concluded in the letter. “While there is strong potential for increasing economic growth as a partial solution, we should not count on growth alone to address our fiscal problems.”
Small business job openings declined sharply in May while concerns over rising labor costs reached the highest level in the survey’s history, according to the National Federation of Independent Business (NFIB) May Jobs Report released Friday.
The NFIB Small Business Employment Index remained essentially flat in May, standing at 100.3 after 100.4 in April. This marks the third consecutive monthly decline. The index now sits below the 2025 average of 101.2, though it remains slightly above the long-term historical average of 100.
In May, 29% of small business owners reported job openings they could not fill, a 5-point drop from April and the lowest reading since May 2020. Openings for skilled workers fell 2 points to 27%, while openings for unskilled positions dropped 4 points to 9%.
“Concerns about rising labor costs increased significantly to the highest reading in the survey’s history,” stated Chief Economist Bill Dunkelberg. “Small business owners are facing mounting pressure to retain workers, and many firms are navigating costly new state mandates. While current conditions restrict Main Street’s already-thin profit margins, compensation measures remain steady for now.”
Arizona-specific concerns added to the unease. “Arizona small businesses are growing increasingly uneasy as labor costs climb and uncertainty around state tax policy remains unresolved,” NFIB State Director Chad Heinrich added. “Failure to conform with the business provisions Congress made permanent at the federal level will result in a tax hike on Main Street Arizonans. Small businesses need certainty to plan, invest, and create jobs, and time is running short for lawmakers to deliver.”
Looking ahead, hiring plans weakened further. A seasonally adjusted net 9% of owners plan to create new jobs in the next three months, down 4 points from April and the lowest level since May 2020. This falls below the historical average of a net 11%.
Overall, 55% of owners reported hiring or trying to hire in May, up slightly from April. However, 46% of all owners (representing 84% of those actively hiring or trying to hire) reported few or no qualified applicants for open positions.
Labor quality, the most important business problem eased to 13%, the lowest since December 2016. In contrast, labor costs surged in importance, cited by 14% of owners as their top problem — a 5 point increase from April and the highest reading on record.
Despite softening demand for new hires, compensation pressures persisted. A net 31% of owners reported rising worker compensation in May, up 1 point from April. Plans to raise compensation in the coming three months held steady at 18%.
Ethan Faverino is a reporter for AZ Free News. You can send him news tips using this link.
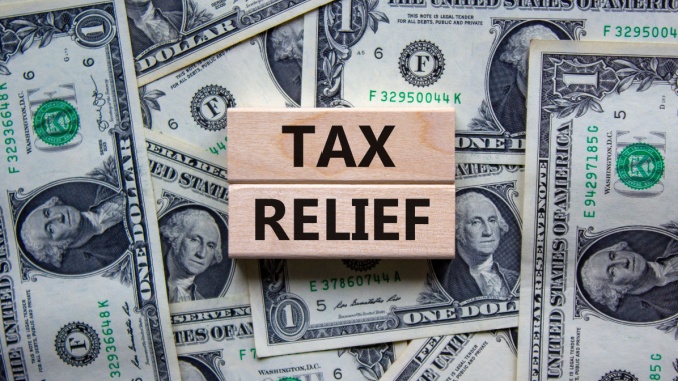
Arizona Republican House and Senate leaders announced a compromise budget agreement with Democratic Governor Katie Hobbs on Tuesday and introduced a series of budget bills for consideration in both chambers.
According to a press release by the GOP Senate Caucus, the budget, totaling $18.29 billion, is designed to deliver approximately $1.45 billion in tax relief to Arizonans over a four-year period and to limit state spending growth to 3.05%. The agreed-upon budget also “rejects or modifies more than $3 billion in proposed executive tax increases, fees, and spending expansions over the next three years.”
The legislative GOP leadership and Gov. Hobbs have been embroiled in tense on-again-off-again negotiations since January, with Hobbs announcing a full moratorium on signing legislation, vetoing nearly all bills sent to her desk from April 13 until May 14, including a proposed Republican budget containing over $1 billion in tax relief.
🚨FOR IMMEDIATE RELEASE: Arizona Becomes Only State in the Nation to Deliver Historic Trump Tax Cuts As Part of Bipartisan FY 2027 Budget Agreement
“Arizona is leading the nation once again,” Senate President Warren Petersen (R-LD14) said in a statement. “For years, Arizona has built a reputation as one of the best places in America to live, work, raise a family, and start a business. This budget strengthens that foundation. Families are facing higher costs for groceries, childcare, housing, and everyday necessities, and we wanted to provide real relief. By adopting President Trump’s tax cuts at the state level, expanding tax relief for families, and protecting educational freedom, we’re helping Arizonans keep more of their hard-earned money while ensuring our state remains economically competitive.”
Looks like we have a deal on the budget. Arizona will be the first state in the nation to deliver the full Trump tax cuts! Proud of my colleagues in the House and Senate. Expecting to vote it out on Thursday. And this time, it will get signed.
The budget reportedly incorporates full conformity with the tax cuts of the One, Big, Beautiful Bill Act passed in 2025, which included several of President Trump’s major federal tax provisions, including:
No tax on tips, no tax on overtime,
An increased standard deduction,
A new childcare deduction,
An enhanced child tax credit,
Expanded charitable giving deductions,
Property tax relief for disabled veterans.
In a statement to AZ Free News, Arizona House Speaker Steve Montenegro (R-LD29) said, “Republicans came into this session focused on affordability, responsible spending, public safety, school choice, and protecting taxpayers from new taxes and fees. This agreement reflects those priorities and shows what can be achieved through serious negotiations in divided government. The process still needs to play out, but this is a responsible budget agreement that moves Arizona in the right direction and puts families and taxpayers first.”
According to the Senate GOP Caucus, the budget agreement will also address the ongoing controversy of data center development in the state through the imposition of “a three-year moratorium on the issuance of new certificates for the data center sales tax exemption while explicitly allowing construction of new data centers to continue.”
In addition to implementing the $1.45 billion in tax relief, the budget will also include:
$112 million for corrections operations,
A 4% correctional officer stipend,
$23 million for victims of crime assistance,
$58 million for child safety operations, including foster care coaching and guardian contract costs,
$25.5 million for county support programs, probation services, coordinated reentry efforts, and sheriff assistance,
$10 million for wildfire suppression efforts,
$4.3 million for rural hospitals.
Reforms packaged with the FY2027 budget also include eligibility verification requirements for Medicaid and SNAP benefits, and protections for the Empowerment Scholarship Account program.
Governor Hobbs praised the bipartisan agreement, saying, “This bipartisan, balanced budget agreement will put Arizona first and deliver opportunity, security and freedom to communities throughout the state. With this agreement, we are delivering a $1.4 billion tax cut for working-class families, investing in job creation, education and water security while tightening our belts, and securing a moratorium on the data center tax exemption so we can develop a responsible path forward that protects our water future and lowers utility bills for Arizona families.”
She added, “This bipartisan compromise shows what we can do when we put common sense before political games and focus on delivering real results for our communities. It will put money back in the pockets of Arizona families and lower costs, make our communities safer, and protect the vital services that Arizonans rely on. In the coming days, I look forward to working with legislators in both parties to pass this bipartisan budget agreement that will make Arizona stronger, safer, and more prosperous.”
House and Senate versions of the budget bills will be considered during a Joint Senate & House Appropriations Committee hearing Wednesday, with final votes set for Thursday.
The U.S. Department of the Treasury reported Tuesday that millions of Americans claimed tax relief under President Donald Trump’s Working Families Tax Cuts during the most recent filing season. According to the analysis, low- and middle-income households received the largest share of the benefits.
According to a June 2 press release from the Treasury Department, taxpayers claimed approximately $82 billion in individual tax relief through the April filing deadline under provisions included in the Working Families Tax Cuts. Treasury officials said the total is expected to increase as taxpayers who requested filing extensions continue submitting returns.
Treasury Secretary Scott Bessent said the data demonstrates that the tax package delivered significant relief to working Americans and families.
“American families and workers overwhelmingly benefited from the Working Families Tax Cuts, receiving the largest share of the historic tax relief delivered this past filing season,” Bessent said. “This analysis confirms President Trump’s tax policies deliver substantial tax cuts to hardworking Americans and provide greater relief and financial certainty to low- and middle-income households.”
While Iran’s economy is in free fall, the regime has chosen to co-opt digital asset technologies for its own corrupt agenda, including evading sanctions and transferring wealth out of the country. Iran’s current economic chaos is proof that @POTUS’ maximum pressure campaign has… https://t.co/CJPNSgccqh
— Treasury Secretary Scott Bessent (@SecScottBessent) June 2, 2026
The Treasury Department stated that without the legislation, taxpayers would have faced the scheduled expiration of the 2017 Tax Cuts and Jobs Act, which officials said would have resulted in approximately $5 trillion in tax increases over time. According to the Treasury, 97% of filers who received a tax cut during the most recent filing season would have owed more in taxes absent the extension of the 2017 tax provisions.
The analysis found that tax relief was concentrated among households earning less than $200,000 annually. The Treasury reported that 96% of filers receiving a tax cut earned less than $200,000 per year, while nearly 70% earned less than $100,000.
Among taxpayers earning between $100,000 and $200,000 who claimed one of the tax provisions, the average tax reduction exceeded $1,250. Taxpayers earning between $50,000 and $100,000 who claimed one of the provisions received an average tax cut of more than $815.
The report highlighted several signature provisions included in the package. The Treasury reported that more than 7.5 million filers claimed the “No Tax on Tips” deduction, receiving an average deduction of more than $7,000. According to the department, 90% of taxpayers claiming the deduction earned less than $100,000 annually, while 99% earned less than $200,000.
More than 29 million filers claimed the “No Tax on Overtime” deduction, with an average deduction exceeding $3,100. The Treasury reported that 75% of taxpayers using the provision earned less than $100,000 annually, while 96% earned less than $200,000.
The department also reported that more than 35 million seniors claimed the Enhanced Deduction for Seniors, receiving an average deduction of more than $7,500. According to the Treasury, 68% of participating seniors earned less than $100,000 annually and 94% earned less than $200,000.
Other provisions cited in the report included the “No Tax on Car Loan Interest” deduction, which the Treasury said was claimed by more than 1.4 million taxpayers purchasing qualifying American-made vehicles. Those taxpayers received an average deduction of more than $1,800. The Treasury reported that 62% of claimants earned less than $100,000 annually and 98% earned less than $200,000.
The Treasury also reported that more than 5.5 million Trump Accounts have been opened since the program’s launch, with approximately 1.4 million qualifying for a $1,000 pilot contribution. According to the department, 86% of the accounts are linked to families earning less than $200,000 annually.
The report further found that nearly 40 million families claimed the enhanced Child Tax Credit, which the Treasury noted was permanently expanded under the legislation. Approximately 65% of participating families earned less than $100,000 annually, while 89% earned less than $200,000.
In addition, the Treasury reported that more than 127 million taxpayers—representing roughly 90% of all filers—claimed the permanently doubled standard deduction during the filing season. The department said the provision continues to simplify tax filing requirements for millions of Americans.