Arizona taxpayers could face nearly $200 million in additional costs if the state fails to reduce its Supplemental Nutrition Assistance Program (SNAP) payment error rate in the coming years.
Data from the U.S. Department of Agriculture shows Arizona’s SNAP payment error rate reached 10.8% in Fiscal Year 2025, ranking 33rd nationally and rising from 8.84% in Fiscal Year 2024.
Under changes enacted through the One Big Beautiful Bill Act (H.R. 1), states with SNAP payment error rates below 6% by Fiscal Year 2028 will avoid cost-sharing requirements with the federal government.
States with error rates between 6-8% must provide a 5% match, those between 8-10% a 10% match, and states exceeding 10% a 15% match.
If Arizona’s error rate remains at 10.8% in Fiscal Year 2028, the state would be subject to the highest matching requirement.
Based on Fiscal Year 2025 figures, eight states recorded error rates below 6% (Idaho, Nebraska, Nevada, South Dakota, Utah, Vermont, Wisconsin, and Wyoming), while six fell between 6-8%. Another 16 states posted rates between 8-10%, and 20 states exceeded 10%.
Zach Milne, senior economist at Common Sense Institute Arizona said the state has a strong incentive to improve its performance.
Mile told The Center Square, “Improving program accuracy strengthens program integrity and helps the state avoid potentially significant federal cost-sharing penalties.”
He described Arizona’s elevated error rate as a relatively recent development, noting that the state’s rate stood at 5.2% in Fiscal Year 2019 — below the new federal threshold.
The Arizona Legislature passed several measures during the 2026 session aimed at lowering the state’s SNAP payment error rate, but they were vetoed by Governor Hobbs.
Senate Bill 1002 would have expanded eligibility verification tools for the Arizona Department of Economic Security, while Senate Bill 1331 proposed work requirements for SNAP recipients age 60 and younger.
Senate Bill 1334 would have barred the department from seeking work-requirement waivers for able-bodied adults without dependents. House Bill 2206 sought to require the state to reduce its SNAP payment error rate to below 3% by 2030.
In her veto messages, Hobbs argued that the legislation duplicated ongoing efforts by the Department of Economic Security to improve accuracy, including enhanced eligibility verification, additional staffing and training, and investments in technology.
“SNAP is the most robust and effective anti-hunger tool we have in Arizona-I know this firsthand,” Hobbs said in her veto letter of the three Senate Bills. “It’s also the most secure, thanks to strong anti-fraud measures and oversight. Instead of creating more needless frustration for Arizona families, I invite you to join me in actually lowering costs for them.”
She also criticized H.R. 1 for imposing unfunded mandates that she said have strained agency resources, noting that she allocated $7.5 million to increase the department’s capacity. Hobbs maintained that the vetoed bills would have added further unfunded requirements without providing resources for implementation or modernization.
Ethan Faverino is a reporter for AZ Free News. You can send him news tips using this link.
The Joint Economic Committee (JEC) released its July 2026 Monthly Debt Update, reporting that the total gross national debt reached $39.38 trillion as of July 3, 2026.
Debt held by the public totaled $31.68 trillion, while intergovernmental debt stood at $7.71 trillion.
According to the JEC, the nation’s debt has risen by $2.81 trillion over the past year and by $10.90 trillion over the past five years.
During the previous 12 months, the debt increased at an average pace of $7.71 billion per day, $321.15 million per hour, $5.35 million per minute, or $89,208.39 per second.
The annual increase equates to $8,204.76 per person and $20,814.36 per household, while total gross national debt now amounts to $115,188 per person and $292,217 per household.
Based on the average daily growth rate observed during the past three years, the United States is projected to surpass $40 trillion in gross national debt around October 2026. At the current pace, each additional trillion dollars of debt would accumulate in approximately 155 days.
The report also highlights the growing cost of servicing the federal debt. As of June 2026, the average interest rate on the total marketable national debt was 3.411% up from 3.375% one year earlier and 1.472% five years ago.
Over the past 12 months, the federal government paid $294.32 billion in interest to trust funds, averaging $24.53 billion per month.
According to projections from the Congressional Budget Office, net interest payments will account for 13.95% of federal outlays in FY26 rising to 14.25% in FY27, and 14.94% in FY28.
Treasury securities remain the primary component of publicly held debt. Of the $31.68 trillion in public debt outstanding, $16.06 trillion is held in notes, $6.69 trillion in bills, $5.45 trillion in bonds, and $3.49 trillion in other securities.
Treasury demands remain robust, with June 2026 bid-to-cover ratios of 2.72 for four-week bills, 2.40 for 10-year notes, and 2.30 for 30-year bonds.
Approximately 33% of publicly held marketable debt is scheduled to mature within the next 12 months, while the average maturity of marketable debt stood at 70 months as of March 2026.
Ethan Faverino is a reporter for AZ Free News. You can send him news tips using this link.
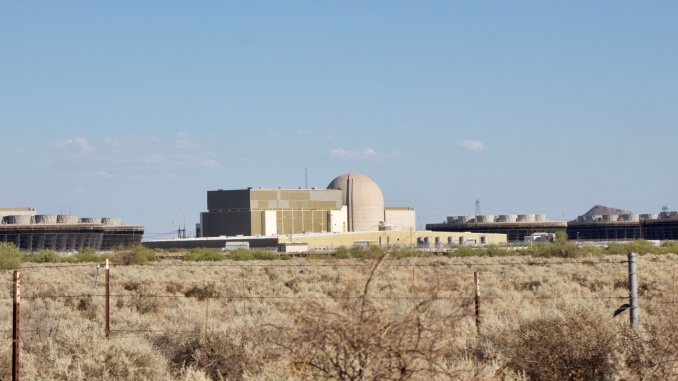
Republican gubernatorial candidate and U.S. Rep. Andy Biggs (R-AZ05) says Arizona should embrace an expanded nuclear future, backing additional reactors at Palo Verde Generating Station while positioning the state to become a national leader in small modular reactor technology.
In an exclsuive interview with AZ Free News, Biggs voiced unequivocal support for expanding Arizona’s nuclear generating capacity as electricity demand continues rising from population growth, advanced manufacturing, and data centers.
“I’m 100 percent behind it,” Biggs said when asked about expanding Palo Verde. “I think they need to be located there.”
His comments come as Arizona utilities continue to pursue license renewals that would allow Palo Verde’s three existing reactors to operate into the 2060s. Palo Verde was also originally envisioned with additional generating capacity, including Units 4 and 5, expansion plans first contemplated in the 1970s and revisited in 2006.
Separately, Arizona Public Service (APS), Salt River Project (SRP) and Tucson Electric Power (TEP) announced in February 2025 that they were working together to identify potential sites for an entirely new nuclear power plant to meet growing energy demands.
“New nuclear generation could provide Arizona with reliable, around-the-clock carbon-free energy to power economic growth while helping us make progress toward a clean energy future,” TEP President and CEO Susan Gray said in a news release at the time. “We know the development timeline would be long, so it makes sense for our state’s energy providers to begin this preliminary evaluation as soon as possible.”
Biggs also expressed strong support for small modular reactors, commonly known as SMRs.
“I’ve been supportive of the development of SMRs,” he said.
The Arizona legislature considered House Bill 2795 in February, which aimed to ease regulatory barriers for next-generation nuclear power projects in rural Arizona. However, the measure failed to pass in the State Senate.
While Biggs cautioned the technology is probably “not going to be scalable for five to 10 years,” he said Arizona should move aggressively to secure one of the first demonstration projects.
One location stands above the rest, according to Biggs. He said, “We’re advocating that Luke Air Force Base gets an SMR—one of the first nine or 10 that the administration is insisting needs to be there by the end of 2027.”
Biggs said he has been working alongside fellow Arizona Republican members of Congress, including Reps. Paul Gosar (R-AZ09), Eli Crane (R-AZ02), and Abe Hamadeh (R-AZ08), to encourage the effort.
“We want to be on the cutting edge of that. Because I think SMRs are the wave of the future,” Biggs said.
He also said recent meetings with energy-sector officials reinforced that view.
“I just talked to an energy group last week, and they agree SMRs are the wave of the future. And that’s where we need to be going.”
Biggs also tied nuclear development to Arizona’s broader economic future, saying reliable baseload power will be essential as advanced manufacturing, semiconductor production, artificial intelligence, and data centers continue expanding throughout the state.
Although he said he supports data center investment, Biggs argued such projects should proceed without taxpayer subsidies or preferential treatment.
“No special breaks. No special benefits,” he said.
Instead, Biggs said developers should be responsible for securing their own electrical generation—including SMRs where appropriate—while ensuring existing residential and commercial ratepayers are not displaced by new industrial demand.
His comments come as Arizona utilities and policymakers increasingly examine nuclear energy as part of the state’s long-term strategy to meet growing electricity demand while maintaining grid reliability.
Biggs is seeking the Republican nomination for governor, making energy development one of several major policy areas he says will shape Arizona’s long-term economic competitiveness.
The Joint Economic Committee’s latest analysis of federal trade data shows the U.S. trade deficit widened in May, reaching $77.58 billion — the largest monthly gap since March 2025.
The deficit increased by $23.02 billion from April and stood 28% above its 12-month average as exports declined and imports climbed.
Goods trade accounted for the bulk of the imbalance, with the goods deficit rising to $106.48 billion, up $23.57 billion from April, while the nation’s services surplus increased modestly to $28.90 billion, up $557 million from April.
Total exports fell to $317.68 billion in May, led by a decline in goods shipments of $11.29 billion, whereas imports rose to $395.26 billion as purchases of both goods and services increased by $12.50 billion.
Over the twelve months ending in May 2026, the United States recorded a cumulative trade deficit of $728.02 billion. Goods trade posted a $1.06 trillion deficit, partially offset by a $336.00 billion surplus in services. During that period, exports totaled $3.59 trillion and imports reached $4.32 trillion.
The nations largest goods trade deficits were with Vietnam ($203.85 billion), Mexico ($199.18 billion), and Taiwan ($194.38 billion), while its largest surpluses were with the Netherlands ($75.57 billion), the United Kingdom ($44.48 billion), and Hong Kong ($41.23 billion).
Civilian aircraft and related equipment, non monetary gold, and pharmaceutical preparations led the U.S. exports by value, accounting for 17.54% of all exported goods in the past 12 months. Whole computers, pharmaceuticals preparations, and computer accessories were the top imports accounting for 19.83%.
Mexico and Canada remained the country’s leading trading partners on both the export and import sides, joined by the United Kingdom among export destinations and China among import sources.
Major gateways for trade activity from May 2025 to May 2026 included the port districts of New York City ($273.88 billion), Houston-Galveston ($266.35 billion), and Laredo ($169.20 billion) for exports.
Over the same period Los Angeles ($379.22 billion), Chicago ($331.73 billion), and Laredo ($328.22 billion) were the port districts with the highest imports.
The United States collected $296.97 billion in import duties over the past year with $21.03 billion in May 2026. Passenger cars, vehicle parts, and electric apparatus generated the greatest duty revenue.
China accounted for the largest share of those duties, followed by Vietnam and Mexico accounting for around 46% of all applied duty rates.
Currency movements also shaped trade conditions. Between May 2025 and May 2026, the U.S. dollar weakened against the Chinese yuan by 6%, the euro by 2.1%, and the Mexican peso by 9.8%, while strengthening against the British pound by 0.5% and Japanese yen by 11.5%.
Exports prices rose 11.21% year-over-year, while import prices increased 4.61%, with fuel imports experiencing particularly sharp inflation at 35.89%.
Ethan Faverino is a reporter for AZ Free News. You can send him news tips using this link.
One year after President Donald Trump signed the Working Families Tax Cut Bill into law, U.S. Rep. Andy Biggs (R-AZ05) defended the legislation as a cornerstone of the nation’s economic recovery, arguing it prevented what he described as a massive tax increase while expanding tax relief for families, workers, and small businesses.
In an exclusive interview with AZ Free News earlier this week, Biggs, who is also running for Arizona Governor, said the legislation’s most immediate accomplishment was preserving tax relief that otherwise would have expired.
“I think what you’re seeing is, the biggest success, is you stopped a $4 trillion tax increase,” Biggs said. “That would have been economically really, really bad for the country—maybe the death knell.”
Biggs said extending the 20 percent deduction for qualifying small businesses and preserving immediate business expensing provisions were among the bill’s most significant accomplishments. He also pointed to Treasury Department estimates indicating many families could see larger tax savings.
“According to the Treasury Department, the average family is going to see somewhere north of $2,000,” Biggs said, adding that other estimates range between $1,500 and $2,000. “That provides money to the economy and stimulus to the economy and helps the working men and women of this country.”
The congressman said some provisions are only beginning to show their long-term effects, particularly expanded domestic energy and natural resource development.
“I think people are getting… that a lot more federal land is being opened up for oil, gas, coal, minerals, whatever those natural resources are,” Biggs said. “Years from now, looking back, people will say, ‘Man, that really was one of the most critical things that could have happened for us.'”
Biggs also cited provisions eliminating federal taxes on tips, reducing taxes on overtime income, and providing tax relief for seniors receiving Social Security benefits as measures designed to increase disposable income while stimulating economic activity.
Critics of the legislation, such as Arizona Senate Minority Leader Priya Sundareshan (D-LD18), have argued it disproportionately benefits higher-income Americans and could increase the federal deficit, as reported by The Center Square. Biggs rejected both claims.
“The problem that we have is not a revenue problem in Washington, D.C.,” Biggs said. “It is a spending problem.”
He argued that economic growth generated by lower taxes ultimately produces additional federal revenue.
“What you do get is more economic activity,” Biggs said. “More taxes ultimately get paid and go into the federal government.”
Looking ahead, Biggs said a future Republican Congress should consider additional tax reductions for businesses while encouraging domestic manufacturing and development of critical mineral resources.
“If you want to stimulate jobs,” he said, “you’d find a way to reduce some of the corporate tax policy… and pass those along to sole proprietors and small firms as well.”
Although Biggs described the legislation as comprehensive, he said one area he wished Congress had addressed more aggressively was healthcare policy.
“One thing that we didn’t take care of, in my opinion… is we did nothing really on healthcare costs in the One Big Beautiful Bill,” Biggs said.
He said he had introduced legislation to expand Health Savings Accounts and increase their portability, adding that Rep. Eric Burlison of Missouri had proposed similar but broader reforms.
“I would have liked to see us do more on tax policy related directly to healthcare as well,” Biggs said.
Speaking with KTAR’s Mike Broomhead Monday, Biggs also discussed fraud in Medicaid and the Indian Health Services program. In a post to X sharing a clip he wrote, “When we root this waste out, we’ll get taxpayer dollars back in the pockets of Arizonans so families and businesses can thrive.”
There’s still billions of fraud in Arizona, especially in Medicaid and our Indian Health Services program.
When we root this waste out, we’ll get taxpayer dollars back in the pockets of Arizonans so families and businesses can thrive.
Looking ahead to a possible Biggs administration, he said future state tax policy should continue focusing on healthcare affordability and higher education while complementing the broader economic approach established by the federal legislation.
“The affordability of housing” remains Arizona’s largest economic challenge, Biggs said, arguing that utility costs, water policy, and management of state trust lands all play significant roles in addressing long-term affordability.
Biggs, who declined to seek another term in Congress to run for Governor, said Arizona has already incorporated many of the federal tax provisions into state law, though he criticized Gov. Katie Hobbs for initially vetoing related legislation before later signing it.
The U.S. labor market continued to expand in June, but at a significantly slower pace than economists expected, as hiring cooled and fewer Americans participated in the workforce, according to the latest Monthly Employment Update released last week by the Joint Economic Committee.
The economy added 57,000 non-farm payroll jobs in June, including 49,000 private-sector jobs and 8,000 government positions. While the national employment rate edged down from 4.3% to 4.2%, the improvement coincided with a 0.3 percentage-point decline in the labor force participation rate to 61.5%, indicating fewer Americans were either working or actively seeking employment.
The broader U-6 unemployment rate, which includes underemployment workers and those marginally attached to the labor force, also declined from 8.1% to 7.9%.
The June report follows downward revisions to previous employment data. The Bureau of Labor Statistics revised May’s job growth downward by 43,000 jobs, reducing the month’s gain from 172,000 to 129,000 jobs. April’s final revision, meanwhile, increased payroll growth by 33,000 jobs to a total gain of 148,000.
Among industries, private education and health services led monthly hiring with 69,000 new jobs, followed by professional and business services, which added 36,000 positions. Leisure and hospitality posted the largest decline, shedding 61,000 jobs, while the information sector lost 9,000 positions.
Over the past year, private education and health services has remained the nation’s strongest-performing sector, adding 648,000 jobs, followed by leisure and hospitality with 114,000.
Federal government employment experienced the steepest annual decline, falling by 258,000 jobs, while financial activities lost 100,000 positions.
Despite slower hiring, wages continued to outpace inflation. Average weekly earnings for all private-sector employees increased 3.82% over the past year, while average hourly earnings rose 3.52%.
Production and nonsupervisory workers saw annual increases of 3.73% in weekly earnings and 3.42% in hourly earnings.
Job Openings Hold Steady Despite Cooling Labor Market
Separate data from the Job Openings and Labor Turnover Survey showed labor demand remained relatively stable. Total job openings increased by 9,000 in May to 7.59 million nationwide, with the job openings rate holding steady at 4.6%
Leisure and hospitality recorded the largest increase in available positions, followed by trade, transportation, and utilities, while private education and health services posted the largest decline in openings.
State-level employment data reflected a mixed picture across the country. Unemployment rates declined in 20 states during May, increased in nine states, and remained unchanged in 22 states and the District of Columbia.
The District of Columbia recorded the nation’s highest unemployment rate at 6.1% while South Dakota posted the lowest at 2.1%
Payroll employment increased in 38 states and fell in 13 states during May. West Virginia recorded the nation’s largest percentage increase in payroll employment at 1.4% while Montana experienced the largest decline at 0.5%.
Arizona continued to rank among the nation’s stronger performing states for job growth despite signs of a slowing labor market.
The state added 2,000 net payroll jobs in May after adding 8,100 jobs in April. Over the past 12 months, Arizona has added 21,200 payroll jobs, tying for the 10th nationally in percentage growth of non-farm employment.
Arizona’s private sector added 22,900 jobs over the past year, ranking tied for ninth nationally in private-sector payroll growth.
Arizona’s unemployment rate increased slightly to 4.8% in May up from 4.7% the previous month and 4.3% one year earlier. Employment in the state declined by 16,293 during the month and has fallen by more than 66,000 over the past year.
The state’s labor force participation rate also weakened, falling from 61% to 60.7% in May, placing Arizona 37th nationally.
Nationally, labor force participation remained at 61.8% during May before declining to 61.5% in June.
Arizona’s strongest monthly employment gain came in construction, which added 1,300 jobs, and financial activities, which added 700 jobs. State and local government employment declined by 1,000 positions, while professional and business services lost 300 jobs.
Over the past year, Arizona’s private education and health services sector led all industries with 16,600 new jobs, followed by professional and business services with 8,100.
Financial activities experienced the largest annual decline, losing 4,000 jobs, while federal government employment fell by 3,200 positions.
Ethan Faverino is a reporter for AZ Free News. You can send him news tips using this link.