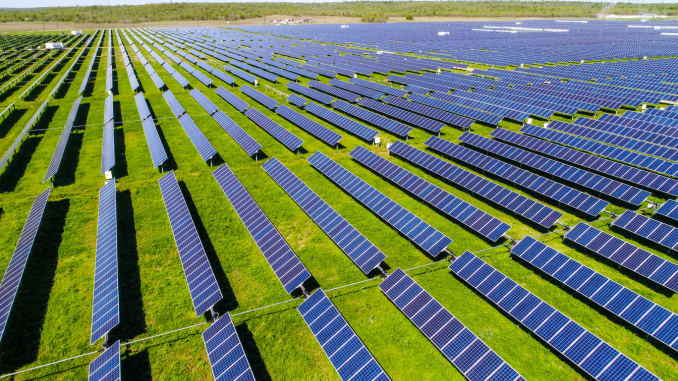
I have to admit that I laughed out loud – almost spewing coffee on my keyboard – Friday morning when I read this headline from a competing platform’s energy-related newsletter: “SOLAR DOESN’T USE MUCH FARMLAND: Solar occupies less than 1% of farmland in the U.S., according to the Solar Energy Industries Association.”
To paraphrase from former President Bill Clinton’s grand jury testimony, that depends on what the meaning of “much” is. Curious about the subject, I decided to research the question, accessing a wealth of public information easily available to anyone, including those in the solar industry. The answer I found might surprise the folks at the Solar Energy Industries Association. Or maybe it wouldn’t, which might explain why they choose to couch the answer in such a misleading way.
The salient question: How many acres make up 1% of U.S. farmlands?
According to the USDA’s most recent data, the 2025 total land in farms is 873.95 million acres (down slightly from prior years). Earlier years were a bit higher (e.g., ~900 million in 2017), but the total has been gradually declining. One percent of 873.95 million acres = 8.74 million acres.
Farmland here generally refers to “land in farms” per USDA definitions (including cropland, pasture, woodland, etc., on farms). Figures can vary slightly by source or definition (e.g., cropland-only vs. all agricultural land), but the ~874 million acre range is the standard benchmark from official USDA reports.
Now, for some context. The King Ranch in South Texas is arguably the largest and most celebrated big farming and ranching operation in U.S. history. Established in 1854 by pioneering rancher Richard King, the ranch at its peak consisted of 1.2 million acres.
Thus, the solar power industry itself admits that its wind arrays currently occupy an area of fertile farmlands that is roughly 8 times the size of the biggest farming and ranching operation in United States history. That is a stunning number, yet the authors of that referenced newsletter characterize it as being “not much.”
Being a guy who grew up in a farming and ranching family, that sure seems like “much” to me. It also most likely seems like “much” to experts whose own studies find that placing solar arrays atop farmlands robs the land of crucial nutrients and renders it more vulnerable to erosion. Disturbingly, unless radical changes are quickly made, the industry plans to cover up many more King Ranch-sized swaths of fertile land in the coming years.
A 2024 report by the Institute for Energy Research finds that, despite these warnings by experts in the field, the vast majority of new solar projects are targeting farmland to house their industrial projects in the coming years. “The target for solar operations is increasingly in the Midwest, where government handouts to solar allow them to pay more to rent land than the farmers providing food for the nation,” the report says, adding, “Farmland preservation groups believe 83 percent of new solar installations will come from farm and ranch lands with half of these installations on the richest land for food and crops.”
Fortunately, the big federal subsidies which drove the recent huge solar expansion are scheduled to begin expiring in July. But with hundreds of new solar projects already in the queue, millions more acres of fertile farmlands will be removed from the food system in the years to come even as a fertilizer shortage threatens to disrupt global food supplies. All to create unreliable, unpredictable, intermittent electricity for a few hours a day that could be provided by an array of more reliable power sources which occupy a fraction of the land, none of which intentionally target farmlands as their homes.
It’s a completely irrational misallocation of hundreds of billions of dollars in capital brought to us directly by the Biden autopen presidency and its Orwellian Inflation Reduction Act. You could never make this stuff up if it weren’t already happening before your very eyes. Watch it and weep.
David Blackmon is a contributor to The Daily Caller News Foundation, an energy writer, and consultant based in Texas. He spent 40 years in the oil and gas business, where he specialized in public policy and communications.
In the first five months of 2025, solar and wind dominated new U.S. electricity generation. Of the 15 gigawatts (GW) added, solar was 11.5, wind was 2.3, and gas was just 1.3, according to the Federal Energy Regulatory Commission (FERC). Industry voices like Stephanie Bosh of the Solar Energy Industries Association hail this as proof that solar delivers power “faster and cheaper than any other source.” Is this true?
As we accelerate toward a grid increasingly reliant on wind and solar, a closer look reveals a troubling reality: these intermittent sources are driving up electricity costs, not slashing them, through a web of hidden expenses that threaten reliability and affordability.
Solar and wind’s part-time nature is the root issue. Solar generates nothing at night, little in the first and last hours of daylight, and falters under clouds, rain, or snow. Wind generation varies unpredictably. This intermittency doesn’t just displace fossil fuels like natural gas and coal—it forces them into inefficient backup roles.
Calling fossil fuels backups is a misuse of the English language that only serves the wind and solar industrial complex. It’s equivalent to calling the starting pitcher a backup in favor of a pitcher who can only play when the wind blows or the sun shines.
Hydrocarbon, coal and natural gas plants, with fixed costs (capital, maintenance, and employees) comprising 60-75% of operational costs, must raise prices on reduced sales volumes to break even. As renewables flood the market during peak production, they suppress wholesale prices temporarily, where subsidized low-bid renewables set the prices for all. In other grids, they get windfall profits, getting the highest price paid for electricity.
Yet, in the “pay-as-clear” system, evening ramps or scarcity periods spike prices, as expensive peaker plants — needed more frequently for renewable gaps caused by the addition of wind and solar — set the highest price, which is paid to all.
Consider the evidence from high wind and solar regions. California’s residential rates are 30-35 cents/kWh—nearly double the U.S. average of 17 cents — despite 50% wind and solar. Germany’s prices top 36-41 cents/kWh with 55% from wind and solar; Denmark and the UK follow suit at 37 and 29-32 cents, respectively.
These ambitious transitions expose the myth: wholesale dips from renewables are overshadowed by retail hikes from taxes, subsidies, grid upgrades, peakers, and using full-time coal and natural gas part-time.
In California, demand from EVs and data centers exacerbates this, and intermittency demands more peakers. These peaker plants run inefficiently, emit more when ramping up, and charge more because they are only used some of the time, causing costly price spikes. They set the price all generators are paid with the take-and-pay system.
In a grid of only hydro, nuclear, gas, and coal — dispatchable sources—peaker needs plummet. These can load-follow predictably, handling demand peaks without the supply volatility renewables cause. Hydro ramps quickly; nuclear provides steady baseload, natural gas and coal are dispatched to match demand. The system worked and was cost effective.
Pre-renewable grids used peakers sparingly, at 4-10%, versus 20% or more in solar-heavy systems like California, where the solar “duck curve” (charting solar generation creates a graph that looks like a duck, no production at night, the belly of the duck, ramp up during the day, the neck of the duck, with a sharp drop as the sun sets, the downward beak of the duck) requires rapid evening ramps of 10-20 GW.
Adding renewables means building more costly, underutilized peaker plants, inflating bills. Cancelling out much of the CO2 emission reductions that are the stated reason for adding costly disruptive wind and solar.
Transmission costs compound the problem. Wind thrives in remote plains or offshore; solar thrives in distant deserts. Connecting these to cities demands expensive high-voltage lines that cost $1-3 million per mile. Thousands of more miles than are needed for nearby hydrocarbon or nuclear plants.
U.S. estimates peg a price tag of $450 billion by 2035 for renewable integration, adding at least 2 cents/kWh to rates. In Germany, €70 billion in upgrades add 3 cents/kWh. Claims of renewables being “cheaper” rely on levelized cost of electricity (LCOE), ignoring transmission and peaker costs. Solar’s $30-50/MWh jumps 30% or more when transmission and backups are factored in.
FERC projects 84% of 133 GW additions by 2028 will come from wind and solar, making our grids less reliable and more expensive.
Policies like the One Big Beautiful Bill Act, which stripped tax subsidies and credits may slow growth, but the trend persists. We need honest accounting. We cannot ignore the wind and solar reality: more blackouts and ever higher prices.